Volume 30, Number 9—September 2024
Research
Infection Rates and Symptomatic Proportion of SARS-CoV-2 and Influenza in Pediatric Population, China, 2023
Cite This Article
Citation for Media
Abstract
We conducted a longitudinal cohort study of SARS-CoV-2 and influenza rates in childcare centers and schools in Wuxi, China, collecting 1,760 environmental samples and 9,214 throat swabs from 593 students (regardless of symptoms) in weekly collections during February–June 2023. We estimated a cumulative infection rate of 124.8 (74 episodes)/1,000 persons for SARS-CoV-2 and 128.2 (76 episodes)/1,000 persons for influenza. The highest SARS-CoV-2 infection rate was in persons 18 years of age, and for influenza, in children 4 years of age. The asymptomatic proportion of SARS-CoV-2 was 59.6% and 66.7% for influenza; SARS-CoV-2 symptomatic proportion was lower in 16–18-year-olds than in 4–6-year-olds. Only samples from frequently touched surface tested positive for SARS-CoV-2 (4/1,052) and influenza (1/1,052). We found asynchronous circulation patterns of SARS-CoV-2 and influenza, similar to trends in national sentinel surveillance. The results support vaccination among pediatric populations and other interventions, such as environmental disinfection in educational settings.
SARS-CoV-2 and influenza have caused substantial health threats. SARS-CoV-2 had caused >0.7 billion reported cases and 6.9 million deaths globally by May 2023, when the World Health Organization (WHO) declared the end of the Public Health Emergency of International Concern for COVID-19 (1,2). After several large waves during 2020–2022, SARS-CoV-2 continued to circulate at lower levels in 2 subsequent waves in November 2022–February 2023 and April–June 2023, according to the WHO Global Influenza Surveillance and Response System (3). Seasonal influenza causes annual epidemics, leading to an annual average of 0.3–0.6 million deaths globally (4). Although seasonal influenza declined substantially during the early phase of the COVID-19 pandemic, a resurgence of influenza was seen in December 2021 and afterward; activity gradually increased in 2 waves during December 2022–May 2023 (3).
In China, influenza epidemics primarily associated with influenza virus A(H3N2) were observed during April–December 2022, followed by a major SARS-CoV-2 epidemic during December 2022–February 2023 (5). The changes observed after nonpharmaceutical intervention (NPI) requirements were eased might reflect shifts in population-level immunity for SARS-CoV-2 and influenza, as well as changes in characteristics associated with Omicron variant predominance, which raises new questions on the infection extent and age-dependent risk profiles for SARS-CoV-2 and influenza.
Young children and students are commonly considered a priority group for prevention and control of seasonal respiratory viral infections, either because of their high susceptibility to severe outcomes or their role in virus transmission (6–8). However, the extent of influenza infections among pediatric populations and in educational settings remains unclear because of lack of data, as do the infection rate and age distribution of SARS-CoV-2 after the period of Omicron predominance (9–15). Reviews conducted before the Omicron period of predominance found low SARS-CoV-2 transmission among pediatric populations and in educational settings, yet many of those data were collected while NPIs were in place (10,11,13). New data quantifying infection rates and variations between age groups are necessary to develop and refine vaccination and control strategies for SARS-CoV-2 and influenza. Furthermore, comparing SARS-CoV-2 with influenza could offer insights for delineating between-virus heterogeneities in transmission, epidemic trajectories, and responses to control measures. Previous studies comparing SARS-CoV-2 and influenza have focused on clinical symptoms and severe outcomes, such as hospitalization and death (16–18), rather than comparing infection risk profiles of the 2 viruses in the same pediatric population.
Accurately estimating the incidence of respiratory viral infections is challenging because infections are usually partially observed in surveillance of active infections. Symptomatic infections are not fully captured because of lack of systematic testing, and mild and asymptomatic infections are particularly underrepresented because testing has primarily focused on symptomatic persons and those with severe illness. Estimating infection risk profile across subgroups and settings is further complicated by variations in the probability of developing symptoms and severe illness. Although seroprevalence indicates the extent of recent infections, distinguishing between seropositivity caused by natural infections or vaccination becomes difficult after widespread vaccination (9). Longitudinal cohort studies with prospective and intense virological testing could provide valuable information in this context. Few longitudinal cohort studies have quantified infection rates of SARS-CoV-2 and seasonal influenza among pediatric populations, and particularly after the Omicron wave and widespread vaccination (11,14,15,19–21).
Schools and childcare centers are primary settings for daily activities and interactions of the pediatric population, making them key settings for the spread of respiratory viruses within that group. We conducted a prospective and longitudinal cohort study in educational settings in Wuxi, China, investigating infection rates and age-dependent risk profiles of SARS-CoV-2 and influenza among the pediatric population. We report data over a full school term, spanning February–June 2023, corresponding to a period of increased influenza and SARS-CoV-2 activity in China (22).
Study Design and Participants
We conducted this cohort study in the city of Wuxi in Jiangsu Province, China. Wuxi spans an area of >4,500 km2, including 5 districts, 2 county-level cities, and the Economic Development Zone. Wuxi had a resident population of 7.5 million in 2022, of which ≈1 million persons 4–18 years of age were enrolled in childcare centers and primary and secondary schools.
We conducted the study during a spring/summer school term during February–June 2023. We used a multistage sampling scheme, and first selected 2 childcare centers, 2 primary schools, 2 junior secondary schools, and a high school in rural and urban settings (Appendix Table 1). Assuming a 12%–18% attack rate of SARS-CoV-2 and influenza and a 5% loss to follow-up, we aimed to enroll a total of 595 persons and on average 85 persons per school (23,24). Assuming a lower attack rate of 5%, the sample size is sufficient to detect a difference of 9.5% or more between groups with 80% power and 5% level of significance. Given the required sample size, we randomly selected 4 classes in each childcare center and 2 classes in each school, and all students in the selected classes were invited to participate in this study. The study received ethics approval from Wuxi Center for Disease Control and Prevention (approval no. 202302). Informed consent or parental permission was obtained for all participants. We conducted analyses anonymously.
Data Collection and Follow-up
Follow-up was conducted weekly for SARS-CoV-2 and influenza infections, regardless of symptoms. Trained school doctors in each institution collected throat swab samples each week, except during the national holiday on May 1 and at the end of June, when semester exams and summer break gradually began across the institutions. School doctors interviewed persons who tested positive for SARS-CoV-2 or influenza, or the parents of children in childcare centers and primary schools, to collect information on respiratory symptoms during the week after the positive test using a predesigned questionnaire (Appendix Table 2). Information on participants’ sex, age, and COVID-19 and influenza vaccination history were collected using questionnaires and by linking with the local vaccination registry.
We collected environmental samples on the day of respiratory sample collection each week in each school. We collected swab samples from frequently touched surfaces (e.g., handrails, floors) and surfaces of infrequent touch (e.g., lights and ceilings) for viral detection (Appendix).
Laboratory Methods
Respiratory specimens and environmental samples were placed in viral transport medium and transported at 2–8°C to district Center for Disease Control and Prevention laboratories within 6 hours. They were stored at −80°C until nucleic acid extraction. We extracted viral RNA using nucleic acid diagnostic kits (Sansure Biotech [https://www.sansureglobal.com] for SARS-CoV-2; Jiangsu Bioperfectus [https://www.bioperfectus.com] for influenza). We tested each sample for SARS-CoV-2 and influenza virus within 48 hours of its receipt using real-time reverse transcription PCR (RT-PCR) and the nucleic acid test kit.
Definitions
SARS-CoV-2 and influenza infections were confirmed when throat swabs tested positive on real-time RT-PCR, regardless of symptoms. Multiple positive test results of throat swabs collected from one person within 28 days were considered 1 episode (14). We defined a symptomatic SARS-CoV-2 or influenza episode as a person reporting >1 symptom, including fever (body temperature >38°C), respiratory infection symptoms (cough, sore throat, congested nose, runny nose, or sneezing), or other symptoms (fatigue or vomiting).
Statistical Analysis
We excluded participants who did not meet the eligibility criteria on sample collection and testing (Appendix). We estimated cumulative infection rates and 95% CIs of SARS-CoV-2 and influenza infections by dividing the number of infection episodes by the number of participants using a Poisson distribution. We used the logistic regression model to investigate factors of infections and symptomatic infections. To depict epidemic dynamics of SARS-CoV-2 and influenza, we estimated weekly virus positivity among participants and environmental positivity using the number of positive test results dividing the number of tests each week, in comparison to the weekly influenza and SARS-CoV-2 positivity in influenza-like illnesses (ILI) using country-level sentinel surveillance data (22). To account for variations in the infection rate of the viruses across different types of educational institutions, we calculated the relative intensity of the virus using the number of positive tests each week dividing the total positive test results obtained throughout the study period (25). We compared proportions with χ2 test or Fisher exact tests, as appropriate. We conducted analyses using R version 4.2.3 (The R Project for Statistical Computing, https://www.r-project.org). We considered a 2-sided p value <0.05 to be statistically significant.
Study Participants
Figure 1
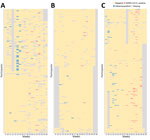
Figure 1. Longitudinal reverse-transcription PCR results of 593 participants by type of educational setting in study of infection rates, symptomatic proportion, and age-dependent risk profiles of SARS-CoV-2 and influenza in pediatric population,...
We enrolled 666 participants and excluded 73 participants that did not meet the eligibility criteria, yielding 593 (89.0%) participants included in the analysis. During the 18-week study period, we sampled and tested a total of 9,214 throat swabs, and each participant had 15.5 (95% CI 15.4–15.7) RT-PCR tests on average (Figure 1). We collected, on average, 15.3–16.1 respiratory samples across the educational settings and age groups (Appendix Table 4).
Infection Rates and Age-Dependent Risk Profiles
Figure 2
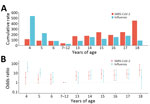
Figure 2. Infection rates and risk for SARS-CoV-2 and influenza infections by narrower age groups in study of infection rates, symptomatic proportion, and age-dependent risk profiles of SARS-CoV-2 and influenza in pediatric...
We identified 74 episodes of SARS-CoV-2 infections, yielding a cumulative rate of 124.8 (95% CI 98.0–156.7)/1,000 persons. SARS-CoV-2 infection rates varied significantly between types of educational settings, urban/rural settings, and age groups (Table 1; Figure 2). By types of educational settings, the rate ranged from 40.5 (95% CI 16.3–83.4)/1,000 persons in primary schools to 256.1 (95% CI 158.5–391.5)/1,000 persons in high schools. The infection rate per 1,000 persons was 153.6 (95% CI 115.1–200.9) in urban settings and 84.7 (95% CI 52.4–129.4) in rural settings. The infection rate was highest among persons 18 years of age and lowest in those 7–12 years of age (Figure 2). We found no statistically significant associations between SARS-CoV-2 infection and sex or vaccination history (Table 1).
We identified 76 influenza episodes, yielding a cumulative rate of 128.2 (95% CI 101.0–160.4)/1,000 persons (Table 1). Although the overall infection rate of influenza was similar to that for SARS-CoV-2, the influenza infection rate was higher than SARS-CoV-2 in childcare centers and among children 4–6 years of age (Table 1). Influenza infection rates were associated with types of educational settings, urban or rural settings, and age groups, and the infection rate was highest in childcare centers (219.7/1,000 persons), and lowest in primary schools (23.1/1,000 persons). The infection rate per 1,000 persons was 176.8 (95% CI 135.2–227.1) in urban settings and 60.5 (95% CI 33.9–99.8) in rural settings. By single year of age, the highest influenza infection rate was seen in children 4 years of age (Figure 2). We found no significant association between influenza infection risk and sex. Only 0.5% of the participants had received influenza vaccines in the 2 years before this study, and influenza vaccination history was not assessed in this study.
A total of 6 (8.1%) of the participants infected with SARS-CoV-2 and 5 (6.6%) participants infected with influenza tested positive in 2–3 consecutive weeks. Of those 11 participants, 9 (82%) were 14–15 years of age and 2 were 4–6 years of age.
Circulation Patterns
Figure 3
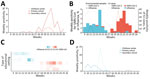
Figure 3. Circulation of SARS-CoV-2 and influenza during the spring/summer school term, February–June 2023, in study of infection rates, symptomatic proportion, and age-dependent risk profiles of SARS-CoV-2 and influenza in pediatric population,...
The study period was from the 9th week through the 26th week of 2023. SARS-CoV-2 infections were sporadically detected during the 13th–15th week in secondary schools; subsequently, infections were identified continuously each week from the 18th through the 26th week (Figure 3, panels A, B). SARS-CoV-2 positivity reached its peak in the 22nd week. The SARS-CoV-2 circulation dynamic varied across types of educational settings; a clearly defined peak and a longer duration of circulation was seen in secondary schools, whereas plateaus and more flattened infection curves were seen in childcare centers and primary schools (Figure 3, panels A, C).
Influenza virus was circulating before SARS-CoV-2 and was detected continuously from the 9th week through the 16th week, reaching its peak in the 14th week (Figure 3, panel B). Sporadic infections were identified during weeks 20–23. Variations in the influenza circulation pattern were found between types of educational settings; influenza infections peaked sharply in childcare centers and more flattened infection curves were seen in secondary schools (Figure 3, panels C, D).
The dynamic of SARS-CoV-2 and influenza positivity generally mirrored that of SARS-CoV-2 and influenza positivity in ILI in the national sentinel surveillance, with some small differences. For instance, the SARS-CoV-2 epidemic peaked in the 22nd week in our study, whereas it peaked in the 21st week at the national level (Figure 3, panel B). Similarly, the influenza epidemic peaked in the 14th week in our study, whereas it peaked during weeks 10–12 at the national level. Moreover, the ILI–influenza positivity at the national level began to increase before the start of the school term.
Symptomatic Proportion and Symptoms
We collected symptom data for 47 (63.5%) of SARS-CoV-2 episodes and 39 (51.3%) of influenza episodes. Of those, 19 (40.4%) SARS-CoV-2 and 13 (33.3%) influenza episodes were symptomatic. The odds of SARS-CoV-2 symptomatic infection was significantly lower (odds ratio 0.1 [95% CI 0.0–0.8]) among persons 16–18 years of age than for those 4–6 years of age (Table 2). Cough (13/19) was the most frequently reported symptom for SARS-CoV-2, followed by runny nose (9/19) and congested nose (7/19). No participants with symptomatic SARS-CoV-2 infections reported seeking medical care.
The most reported symptoms for influenza were cough (7/13), fever (6/13), and runny nose (6/13) (Table 2). For SARS-CoV-2 and influenza, fever was reported only by participants in childcare centers and primary schools, not in secondary schools (Appendix Table 5). Only 2 participants >16 years of age infected with influenza reported symptom data. In total, 20% of participants with symptomatic influenza infections reported seeking medical care.
Environmental Samples
We collected and tested a total of 1,052 environmental samples from frequently touched surfaces and 708 samples from infrequently touched surfaces. All of the positive samples (4/1,052) were collected from frequently touched surfaces during weeks 20–21, corresponding to the period of high SARS-CoV-2–positivity among the participants. In contrast, a lower proportion (1/1,052) of environmental samples collected from frequently touched surfaces tested positive for influenza in the 11th week (Figure 3, panel B).
This prospective longitudinal cohort study investigated infection rates, symptomatic proportion, environmental virus positivity, and circulation patterns of SARS-CoV-2 and influenza among pediatric populations in educational settings. Approximately 85% of participants were fully vaccinated with a primary SARS-CoV-2 vaccine, but none received a booster dose before this study; few received influenza vaccination during the 2022–23 influenza season. We estimated, approximately, an overall infection rate of 125 and 128 per 1,000 persons for SARS-CoV-2 and influenza; nearly 60% of participants infected with SARS-CoV-2 and two thirds of participants infected with influenza were asymptomatic. We found different age-dependent infection risk profiles between SARS-CoV-2 and influenza. The highest SARS-CoV-2 infection rate was in persons 18 years of age, and the highest influenza infection rate was in children 4 years of age. A higher risk for symptomatic SARS-CoV-2 infections was seen in the younger group. The 2 viruses were only detected on frequently touched surfaces. We found asynchronous circulation patterns between SARS-CoV-2 and influenza, similar to trends shown in national-level sentinel surveillance data.
Using a longitudinal design and weekly virological testing regardless of symptoms, this study captured asymptomatic and mild infections, offering insights into transmission characteristics of SARS-CoV-2 across age subgroups in comparison with those of influenza. Aligning with previous SARS-CoV-2 systematic reviews that synthesized cohort and contact-tracing studies and a household cohort study from South Africa in which longitudinal virologic testing was conducted, our results of the age-varying SARS-CoV-2 infection risk indicate a higher extent of transmission among secondary school students than younger groups (11,14,20). In contrast to transmission of SARS-CoV-2, our findings suggest a higher extent of influenza transmission in young children than in older groups, consistent with an influenza cohort study in South Africa (15). That contrasting age-dependent infection risk profile between SARS-CoV-2 and influenza could be a consequence of varying age-dependent susceptibility and infectiousness between the 2 viruses. Contact tracing and cohort studies suggested higher susceptibility and infectiousness for SARS-CoV-2 in older children (>10 years) than in younger groups, which differs from influenza (15,26–30). A study in Nicaragua showed that persons 10–17 years of age shed SARS-CoV-2 longer than younger children (26). Studies in England and South Korea found higher secondary attack rates of SARS-CoV-2 among contacts >10 years of age than among younger children (27,28). In contrast, a higher secondary attack rate of influenza among younger children was found in studies in the United States and Mongolia (29,30). The South Africa influenza cohort study showed a higher risk for onward influenza transmission from index case-patients <5 years of age than index case-patients 5–18 years of age (15). The variations in influenza infection rates found among children 4 and 6 years of age (Figure 2) indicate that age might influence the spread of influenza within childcare centers. We reported infection rates by educational setting because contact patterns could be strongly influenced by social settings. Our results are generally consistent with a prior US study showing that primary school students tend to have fewer distinct contacts than those in junior secondary schools and high schools (31). The infection rates in different educational settings could inform school-based intervention strategies.
A recent meta-analysis found asymptomatic proportions associated with the Omicron variant varied widely from 14% to 57% for all age groups across studies (32). However, few studies have reported data for pediatric populations or by granular age groups. Our results (54% for persons 7–15 years of age) are similar to a seroprevalence study in the United States showing that 49% of Omicron infections were symptomatic among children 5–15 years of age; that study found higher symptomatic proportion for Delta infections (33). We found a lower probability of symptomatic SARS-CoV-2 infection in persons 16–18 years of age than among young children, which might be partly explained by the gradual development and maturation of human immunity from birth to young adulthood, providing protection against symptomatic infection and more severe illness (34). Few studies have reported asymptomatic influenza infections for the pediatric population. Our estimates of symptomatic influenza infections (35% [95% CI 20%–53%] for children 4–15 years of age) appeared slightly lower than that seen in the South Africa influenza cohort study (51% for children 5–12 years of age) (15).
A systematic review of studies conducted before the Omicron wave found that fever and cough were the most prevalent symptoms of SARS-CoV-2 and influenza infections among children with a median age of 5–8 years, broadly similar to the symptoms we observed (16). Of note, fever was reported only by students in childcare centers and primary schools (those 4–12 years of age) in our study, not by older students (Appendix Table 5). Those findings could indicate possible varying symptom profiles (e.g., fever) across age groups, and the inclusion of older and young children might explain why fever was not the most prevalent symptom in our study.
Only the samples collected from frequently touched surfaces when virus activity was high tested positive for SARS-CoV-2 (4/1,052) and influenza (1/1,052). This finding is consistent with a Hong Kong study conducted in childcare centers and primary schools (35). The results suggest that contact by infected persons is a primary cause of environmental contamination in educational settings. Strengthening environmental disinfection could reduce SARS-CoV-2 and influenza transmission in educational settings.
Our results and the data collected by the WHO Global Influenza Surveillance and Response System have shown asynchronous circulation patterns of SARS-CoV-2 and influenza (3), which might indicate negative viral interference between the 2 viruses (36). Similar results have been indicated by population-level and individual-level epidemiologic data (37,38) and the low codetection rates of SARS-CoV-2 and influenza in a recent meta-analysis (39). A recent model of airway epithelium suggests that SARS-CoV-2 replication could be inhibited by antiviral responses triggered by influenza infections (40).
COVID-19 vaccines could prevent infections, thereby reducing virus spread. However, real-life observational data suggest a decline in vaccine effectiveness after 2 doses against infection with the Omicron variant, as well as waning protection over time among children and adolescents (41). In total, 80% of participants had received their last SARS-CoV-2 vaccine dose 12 months before, which might explain the lack of significant effect for SARS-CoV-2 vaccination in our study.
The first limitation of our study is that, although no widespread control measures were implemented, some participants might have adopted precautionary behaviors in response to test results, which might have reduced virus spread. Second, variations in the infection rates were observed between schools of the same type, possibly because of differences in virus transmission between the communities where the schools were located. Age-related estimates, which were derived using a generalized linear mixed meta-regression model accounting for between-school variations, were generally comparable to the main analysis, except for the wider CIs of the influenza infection rate for children 4–6 years of age (Appendix Table 6). Nevertheless, the generalizability of our estimates could be limited by the small number of schools included in this study. Third, symptoms of the infections were self-reported; symptom data was lacking among 43% of the infected persons and could cause biases to the estimates of symptomatic proportions (Appendix Table 4). We acknowledge that the estimation of influenza symptomatic proportion for persons 16–18 years of age is not feasible because of the sparce data. Moreover, we did not consider subtypes of SARS-CoV-2 or influenza virus because of lack of data. We reported data collected from students during a school term after a major SARS-CoV-2 epidemic across the country in late 2022 and early 2023; no participants received a booster SARS-CoV-2 vaccine dose before this study, and influenza vaccination coverage was low. We acknowledge that our findings might be context-dependent, influenced by the population’s immunity level related to infection history and vaccination, as well as the implementation of NPIs. Future studies are needed to investigate possible long-term interactions between influenza and SARS-CoV-2.
Overall, we found different age-dependent infection risk profiles between SARS-CoV-2 and influenza. The highest SARS-CoV-2 infection rate was in persons 18 years of age, and for influenza, in children 4 years of age. A higher proportion of symptomatic SARS-CoV-2 infections was seen in young children than in older groups. Our findings can inform both vaccination strategies and other interventions, such as mask wearing, environmental disinfection, and handwashing in educational settings for the control of SARS-CoV-2 and influenza.
Mr. Shi is an associate professor at Nanjing Medical University and an associate director of Wuxi Centre for Disease Control and Prevention. His primary research interests include the control and prevention of acute infectious diseases.
Acknowledgments
The research was supported by Projects of Wuxi Municipal Bureau on Science and Technology (No. Y20212042), Top Talent Support Program for young and middle-aged people of Wuxi Health Committee (No. BJ2023095), Wuxi Medical Development Disciplines (No. FZXK2021010), and Jiangsu Provincial Department of Science and Technology COVID-19 Emergency Project (No. BE2023603).
X.W. reports personal fees from Pfizer and grants from GlaxoSmithKline outside the submitted work. Y.L. reported grants from the World Health Organization, Wellcome Trust, GlaxoSmithKline, and Pfizer outside the submitted work. All other authors declared that they have no competing interests.
X.W. conceived the study with inputs from B.L., C.S., and Y.L. C.S. and B.L. led the data collection with intellectual inputs from Y.L. and X.W. and inputs from J.Z., Y.G., and Y.W. Y.Z. led the collection of national sentinel surveillance data and the formal analysis and wrote the draft, with substantial contributions from S.Y., X.W., C.S., B.L., and Y.L. and additional intellectual inputs from F.Z., B.C., and S.D. All authors read and approved the final version of the protocol for publication.
References
- World Health Organization. Number of COVID-19 cases and deaths reported to WHO. 2023 [cited 2023 Dec 20]. https://covid19.who.int/data
- Contreras S, Iftekhar EN, Priesemann V. From emergency response to long-term management: the many faces of the endemic state of COVID-19. Lancet Reg Health Eur. 2023;30:
100664 . DOIPubMedGoogle Scholar - Iuliano AD, Roguski KM, Chang HH, Muscatello DJ, Palekar R, Tempia S, et al.; Global Seasonal Influenza-associated Mortality Collaborator Network. Estimates of global seasonal influenza-associated respiratory mortality: a modelling study. Lancet. 2018;391:1285–300. DOIPubMedGoogle Scholar
- Chinese Center for Disease Control and Prevention. Weekly influenza report. 2023 [cited 2023 Dec 27]. https://ivdc.chinacdc.cn/cnic/zyzx/lgzb
- Wang X, Li Y, O’Brien KL, Madhi SA, Widdowson MA, Byass P, et al.; Respiratory Virus Global Epidemiology Network. Global burden of respiratory infections associated with seasonal influenza in children under 5 years in 2018: a systematic review and modelling study. Lancet Glob Health. 2020;8:e497–510. DOIPubMedGoogle Scholar
- McAllister DA, Liu L, Shi T, Chu Y, Reed C, Burrows J, et al. Global, regional, and national estimates of pneumonia morbidity and mortality in children younger than 5 years between 2000 and 2015: a systematic analysis. Lancet Glob Health. 2019;7:e47–57. DOIPubMedGoogle Scholar
- Jackson C, Vynnycky E, Hawker J, Olowokure B, Mangtani P. School closures and influenza: systematic review of epidemiological studies. BMJ Open. 2013;3:
e002149 . DOIPubMedGoogle Scholar - Naeimi R, Sepidarkish M, Mollalo A, Parsa H, Mahjour S, Safarpour F, et al. SARS-CoV-2 seroprevalence in children worldwide: A systematic review and meta-analysis. EClinicalMedicine. 2023;56:
101786 . DOIPubMedGoogle Scholar - Silverberg SL, Zhang BY, Li SNJ, Burgert C, Shulha HP, Kitchin V, et al. Child transmission of SARS-CoV-2: a systematic review and meta-analysis. BMC Pediatr. 2022;22:172. DOIPubMedGoogle Scholar
- Viner RM, Mytton OT, Bonell C, Melendez-Torres GJ, Ward J, Hudson L, et al. Susceptibility to SARS-CoV-2 infection among children and adolescents compared with adults: a systematic review and meta-analysis. JAMA Pediatr. 2021;175:143–56. DOIPubMedGoogle Scholar
- Viner R, Waddington C, Mytton O, Booy R, Cruz J, Ward J, et al. Transmission of SARS-CoV-2 by children and young people in households and schools: A meta-analysis of population-based and contact-tracing studies. J Infect. 2022;84:361–82. DOIPubMedGoogle Scholar
- Vardavas C, Nikitara K, Mathioudakis AG, Hilton Boon M, Phalkey R, Leonardi-Bee J, et al. Transmission of SARS-CoV-2 in educational settings in 2020: a review. BMJ Open. 2022;12:
e058308 . DOIPubMedGoogle Scholar - Cohen C, Kleynhans J, von Gottberg A, McMorrow ML, Wolter N, Bhiman JN, et al.; PHIRST-C Group. SARS-CoV-2 incidence, transmission, and reinfection in a rural and an urban setting: results of the PHIRST-C cohort study, South Africa, 2020-21. Lancet Infect Dis. 2022;22:821–34. DOIPubMedGoogle Scholar
- Cohen C, Kleynhans J, Moyes J, McMorrow ML, Treurnicht FK, Hellferscee O, et al.; PHIRST group. Asymptomatic transmission and high community burden of seasonal influenza in an urban and a rural community in South Africa, 2017-18 (PHIRST): a population cohort study. Lancet Glob Health. 2021;9:e863–74. DOIPubMedGoogle Scholar
- Lee B, Ashcroft T, Agyei-Manu E, Farfan de los Godos E, Leow A, Krishan P, et al.; Usher Network for COVID-19 Evidence Reviews (UNCOVER) group. Clinical features of COVID-19 for integration of COVID-19 into influenza surveillance: A systematic review. J Glob Health. 2022;12:05012. DOIPubMedGoogle Scholar
- Song X, Delaney M, Shah RK, Campos JM, Wessel DL, DeBiasi RL. Comparison of clinical features of COVID-19 vs seasonal influenza A and B in US children. JAMA Netw Open. 2020;3:
e2020495 . DOIPubMedGoogle Scholar - Piroth L, Cottenet J, Mariet AS, Bonniaud P, Blot M, Tubert-Bitter P, et al. Comparison of the characteristics, morbidity, and mortality of COVID-19 and seasonal influenza: a nationwide, population-based retrospective cohort study. Lancet Respir Med. 2021;9:251–9. DOIPubMedGoogle Scholar
- Wiedenmann M, Ipekci AM, Araujo-Chaveron L, Prajapati N, Lam YT, Alam MI, et al. SARS-CoV-2 variants of concern in children and adolescents with COVID-19: a systematic review. BMJ Open. 2023;13:
e072280 . DOIPubMedGoogle Scholar - Irfan O, Li J, Tang K, Wang Z, Bhutta ZA. Risk of infection and transmission of SARS-CoV-2 among children and adolescents in households, communities and educational settings: A systematic review and meta-analysis. J Glob Health. 2021;11:05013. DOIPubMedGoogle Scholar
- Leung NH, Xu C, Ip DK, Cowling BJ. Review article: the fraction of influenza virus infections that are asymptomatic: a systematic review and meta-analysis. Epidemiology. 2015;26:862–72. DOIPubMedGoogle Scholar
- Chinese Center for Disease Control and Prevention. National situation of SARS-CoV-2 infection. 2023 [cited 2023 Dec 25]. https://www.chinacdc.cn/jkzt/crb/zl/szkb_11803/jszl_13141
- Shope TR, Chedid K, Hashikawa AN, Martin ET, Sieber MA, Des Ruisseau G, et al. Incidence and transmission of SARS-CoV-2 in US child care centers after COVID-19 vaccines. JAMA Netw Open. 2023;6:
e2339355 . DOIPubMedGoogle Scholar - Tsang TK, Huang X, Fong MW, Wang C, Lau EHY, Wu P, et al. Effects of school-based preventive measures on COVID-19 incidence, Hong Kong, 2022. Emerg Infect Dis. 2023;29:1850–4. DOIPubMedGoogle Scholar
- Li Y, Hodgson D, Wang X, Atkins KE, Feikin DR, Nair H. Respiratory syncytial virus seasonality and prevention strategy planning for passive immunisation of infants in low-income and middle-income countries: a modelling study. Lancet Infect Dis. 2021;21:1303–12. DOIPubMedGoogle Scholar
- Maier HE, Plazaola M, Lopez R, Sanchez N, Saborio S, Ojeda S, et al. SARS-CoV-2 infection-induced immunity and the duration of viral shedding: Results from a Nicaraguan household cohort study. Influenza Other Respir Viruses. 2023;17:
e13074 . DOIPubMedGoogle Scholar - Miller E, Waight PA, Andrews NJ, McOwat K, Brown KE, Höschler K, et al. Transmission of SARS-CoV-2 in the household setting: A prospective cohort study in children and adults in England. J Infect. 2021;83:483–9. DOIPubMedGoogle Scholar
- Park YJ, Choe YJ, Park O, Park SY, Kim YM, Kim J, et al.; COVID-19 National Emergency Response Center, Epidemiology and Case Management Team. Contact tracing during coronavirus disease outbreak, South Korea, 2020. Emerg Infect Dis. 2020;26:2465–8. DOIPubMedGoogle Scholar
- Rolfes MA, Talbot HK, McLean HQ, Stockwell MS, Ellingson KD, Lutrick K, et al. Household transmission of influenza A viruses in 2021–2022. JAMA. 2023;329:482–9. DOIPubMedGoogle Scholar
- Nukiwa-Souma N, Burmaa A, Kamigaki T, Od I, Bayasgalan N, Darmaa B, et al. Influenza transmission in a community during a seasonal influenza A(H3N2) outbreak (2010-2011) in Mongolia: a community-based prospective cohort study. PLoS One. 2012;7:
e33046 . DOIPubMedGoogle Scholar - Guclu H, Read J, Vukotich CJ Jr, Galloway DD, Gao H, Rainey JJ, et al. Social contact networks and mixing among students in K-12 schools in Pittsburgh, PA. PLoS One. 2016;11:
e0151139 . DOIPubMedGoogle Scholar - Shang W, Kang L, Cao G, Wang Y, Gao P, Liu J, et al. Percentage of asymptomatic infections among SARS-CoV-2 Omicron variant-positive individuals: a systematic review and meta-analysis. Vaccines (Basel). 2022;10:1049. DOIPubMedGoogle Scholar
- Fowlkes AL, Yoon SK, Lutrick K, Gwynn L, Burns J, Grant L, et al. Effectiveness of 2-dose BNT162b2 (Pfizer BioNTech) mRNA vaccine in preventing SARS-CoV-2 infection among children aged 5–11 years and adolescents aged 12–15 years—PROTECT Cohort, July 2021–February 2022. MMWR Morb Mortal Wkly Rep. 2022;71:422–8. DOIPubMedGoogle Scholar
- Simon AK, Hollander GA, McMichael A. Evolution of the immune system in humans from infancy to old age. Proc Biol Sci. 2015;282:
20143085 . DOIPubMedGoogle Scholar - Fong MW, Leung NHL, Xiao J, Chu DKW, Cheng SMS, So HC, et al. Presence of influenza virus on touch surfaces in kindergartens and primary schools. J Infect Dis. 2020;222:1329–33. DOIPubMedGoogle Scholar
- Piret J, Boivin G. Viral interference between respiratory viruses. Emerg Infect Dis. 2022;28:273–81. DOIPubMedGoogle Scholar
- Lampros A, Talla C, Diarra M, Tall B, Sagne S, Diallo MK, et al. Shifting patterns of influenza circulation during the COVID-19 pandemic, Senegal. Emerg Infect Dis. 2023;29:1808–17. DOIPubMedGoogle Scholar
- Stowe J, Tessier E, Zhao H, Guy R, Muller-Pebody B, Zambon M, et al. Interactions between SARS-CoV-2 and influenza, and the impact of coinfection on disease severity: a test-negative design. Int J Epidemiol. 2021;50:1124–33. DOIPubMedGoogle Scholar
- Yan X, Li K, Lei Z, Luo J, Wang Q, Wei S. Prevalence and associated outcomes of coinfection between SARS-CoV-2 and influenza: a systematic review and meta-analysis. Int J Infect Dis. 2023;136:29–36. DOIPubMedGoogle Scholar
- Dee K, Schultz V, Haney J, Bissett LA, Magill C, Murcia PR. Influenza A and respiratory syncytial virus trigger a cellular response that blocks severe acute respiratory syndrome virus 2 infection in the respiratory tract. J Infect Dis. 2023;227:1396–406. DOIPubMedGoogle Scholar
- Piechotta V, Siemens W, Thielemann I, Toews M, Koch J, Vygen-Bonnet S, et al. Safety and effectiveness of vaccines against COVID-19 in children aged 5-11 years: a systematic review and meta-analysis. Lancet Child Adolesc Health. 2023;7:379–91. DOIPubMedGoogle Scholar
Figures
Tables
Cite This ArticleOriginal Publication Date: August 06, 2024
1These authors contributed equally to this article.
Table of Contents – Volume 30, Number 9—September 2024
| EID Search Options |
|---|
|
|
|
|
|
|
Please use the form below to submit correspondence to the authors or contact them at the following address:
Xin Wang or Bing Lu, Nanjing Medical University, 101 Longmian Ave, Nanjing 211166, China
Top