Volume 30, Number 9—September 2024
Dispatch
Participatory, Virologic, and Wastewater Surveillance Data to Assess Underestimation of COVID-19 Incidence, Germany, 2020–2024
Cite This Article
Citation for Media
Abstract
Using participatory, virologic, and wastewater surveillance systems, we estimated when and to what extent reported data of adult COVID-19 cases underestimated COVID-19 incidence in Germany. We also examined how case underestimation evolved over time. Our findings highlight how community-based surveillance systems can complement official notification systems for respiratory disease dynamics.
To monitor COVID-19 epidemic spread, the World Health Organization tracked worldwide incidence by relying on notification data of laboratory-confirmed cases (1). In Germany, public health and social measures (PHSM), such as lockdowns and testing policies, were linked to COVID-19 incidence measured by the country’s routine notifiable disease surveillance system, particularly in the first 1.5 years of the pandemic.
We examined how sensitively the national notifiable disease surveillance system reflected the true COVID-19 incidence in Germany. Our intent was to date and quantify changes in underestimation of national notifiable disease surveillance–derived COVID-19 incidence by relating it to participatory, virologic, and wastewater surveillance systems and to identify PHSM that contributed to changes in surveillance sensitivity.
Our indicator of interest was adult COVID-19 notification incidence in Germany, hereafter GNS-I (German notification system incidence), during 2020–2024. In the notification system, SARS-CoV-2–positive test results were notified to local health authorities, including samples taken from physician practices, citizen testing sites, and systematic testing in workplaces and schools. The system only reported PCR-positive cases; thus, non–PCR-confirmed citizen self-tests were not included in GNS-I data.
We used 2 comparison indicators to estimate COVID-19 incidence: GrippeWeb virologic positivity rate incidence (GW-VPR-I) and GrippeWeb self-reported positivity incidence (GW-SR-I) (Table). GW-VPR-I is incidence among adults calculated through combined data from the GrippeWeb participatory surveillance system (1) and from virologic sentinel surveillance in primary care settings (2), as described previously (3). GW-SR-I is self-reported laboratory or self-testing results from GrippeWeb.
Each week, ≈8,000 GrippeWeb participants in Germany self-report symptoms related to any kind of acute respiratory illness (ARI), which includes any illness with sore throat, cough, or fever. Participants also report potential test results. ARI are dichotomized into influenza-like illness (ILI; i.e., fever with sore throat or cough) and non-ILI. GrippeWeb provides ARI, ILI, and non-ILI incidence rates in the general population (1). The National Influenza Centre conducts virologic surveillance in cooperation with ≈140 practices (general and pediatric practices) that submit nasal or throat swab samples from ARI patients (4). Samples are analyzed by real-time PCR for different respiratory pathogens, including SARS-CoV-2.
To compare GNS-I with GW-VPR-I, we used incidence from calendar week (CW) 40 of 2020 through CW 4 of 2024 (CW40/2020–CW04/2024). To compare GNS-I with GW-SR-I, we included CW27/2022 (beginning of collection of self-reported SARS-CoV-2 detections in GrippeWeb) through CW04/2024. We smoothed GW-VPR-I and GW-SR-I data by using the locally estimated scatterplot smoothing (LOESS) method (5).
Beginning in CW22/2022, SARS-CoV-2 was monitored weekly by wastewater surveillance (WWS) in <153 wastewater treatment plants (6). Data were aggregated as SARS-CoV-2 viral load in wastewater (SC2-VL-WW). We also used LOESS to smooth weekly mean SC2-VL-WW data.
Figure
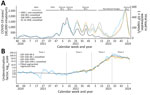
Figure. Incidence and underestimation factors in a study of participatory, virologic, and wastewater surveillance data to assess underestimation of COVID-19 incidence, Germany, 2020–2024. A) Smoothed and unsmoothed surveillance data on COVID-19...
We used an underestimation factor (UEF) to express sensitivity of GNS-I by GW-VPR-I (UEFGW-VPR-I) and GW-SR-I (UEFGW-SR-I), which we calculated as the weekly ratio of smoothed GW-VPR-I and GW-SR-I relative to nonsmoothed GNS-I (Table; Figure). In addition, we gathered information on dates of pandemic related PHSM.
In general, measured COVID-19 incidence by GNS-I, GW-VPR-I, and GW-SR-I, as well as SC2-VL-WW, all agreed in timing of COVID-19 waves (Figure, panel A). GW-VPR-I was similar to the GNS-I until ≈CW17/2022, after which the 2 curves diverged. From CW27/2022, GW-SR-I aligned with GW-VPR-I. SC2-VL-WW confirmed the course of GW-VPR-I and GW-SR-I, which indicated that COVID-19 waves that peaked during CW26/2022, CW38/2022, and CW50/2022 were substantially stronger than suggested by GNS-I.
We identified 4 major sensitivity phases of GNS-I and estimated a segmented linear regression to specify 3 breakpoints (7,8). We calculated a common piecewise trendline of the smoothed UEFGW-VPR-I and UEFGW-SR-I data (Figure, panel B). During phase 1, CW40/2020–CW10/2022, the linear trend of UEFGW-VPR-I varied ≈1.1–1.5, indicating close agreement between GNS-I and GW-VPR-I. Two COVID-19 waves, driven by Omicron BA.1, peaking in CW05/2022, and BA.2, peaking in CW11/2022, were still well captured by GNS-I. During that time, many workplaces, hospitals, nursing homes, kindergartens, and schools tested regularly for SARS-CoV-2. However, during CW10/2022–CW17/2022, regular testing at workplaces and schools was gradually discontinued. Until the end of phase 2 (CW49/2022), smoothed GW-VPR-I and GW-SR-I slowly increased to ≈2.8 (UEFGW-VPR-I was 2.7; UEFGW-SR-I was 2.9).
At the end of 2022, no-cost testing ceased for all citizens, after which we noted a steep increase of both smoothed UEFs during phase 3 (CW49/2022–CW28/2023): UEFGW-VPR-I increased from ≈2.7 to 110.1 and UEFGW-SR-I increased from 2.9 to 81.6 (Figure, panel B). SC2-VL-WW showed similar trends during that period, but GNS-I data barely captured the phase 3 waves.
Through a trend change in both UEFs, we identified a fourth phase starting around CW28/2023 that was not accompanied by PHSM changes. Smoothed UEFGW-VPR-I peaked around CW32/2023, then decreased to ≈30.3; UEFGW-SR-I peaked around CW28/2023, after which it fluctuated between ≈50–70. SC2-VL-WW followed the steady rise of the 2 GrippeWeb indicators and peaked in CW50/2023. GNS-I remained low in phase 4.
One limitation of our study is the incongruence among the indicators; GNS-I includes data for illnesses and asymptomatic infections, whereas GW-VPR-I and GW-SR-I only estimate illness incidence. However, because the information on presence or absence of symptoms is not always available in GNS-I data, deriving a pure COVID-19 incidence from GNS-I is not possible. Another limitation is that WWS provides viral load per liter from all population age groups, and neither incidence nor prevalence data are collected; whether the shedding properties of variants differ enough to substantially modify the viral load detected in wastewater is unknown. Last, the association of sensitivity phases and PHSM is only descriptive and ecologic in nature.
Assessing the timing and degree of COVID-19 underestimation is crucial for interpretating notification system data. Until the first half of 2022, serosurveys among blood donors in Germany estimated the degree of underestimation at ≈1.5 of GNS-I, comparing well with the common piecewise trendline of UEFGW-VPR-I in the same timeframe (UEFGW-SR-I started from CW27/2022) (9). Other than cross-sectional serosurveys (9–11), approaches to estimate underestimation included analysis of fatality rates and death tolls (12,13), and a multiplier model that used reported laboratory-confirmed data as a starting point (14). However, none of those approaches compared weekly notification rates and, thus, cannot pinpoint sensitivity breakpoints. We compared weekly national notifiable COVID-19 incidence to 2 independent indicators estimating population-level incidence, and our findings are supported by WWS results.
We identified 2 major sensitivity breakpoints, demonstrating that PHSM introductions or cessations might have directly affected the changing sensitivity of notification data. Ending systematic testing in workplaces and schools (first breakpoint) and ending no-cost testing (second breakpoint) likely contributed to the decrease of national notifiable disease surveillance system sensitivity. The close agreement between WWS and GrippeWeb-derived incidence indicators suggests that SARS-CoV-2 wastewater data are useful for indicating trends in infection waves.
Although population-level immunity could influence the probability of persons testing COVID-19–positive to some degree, immunity mainly protects against severe disease but does not necessarily prevent infection or illness. For example, the high estimated COVID-19 incidence at the end of 2023 had weekly incidences of >2% (Figure).
As Germany transitioned from the pandemic to endemic phase and implemented a stepwise reduction in testing, GNS-I became less capable of reflecting actual COVID-19 incidence. Our study results stress the value of additional community-based and wastewater surveillance systems to complement official notification systems (15). Community-based surveillance can describe the epidemiologic situation, particularly when PHSM, such as testing policies, are lifted and testing access decreases. Thus, systems like GrippeWeb (and wastewater surveillance) will be increasingly crucial, especially for respiratory diseases of epidemic and pandemic potential.
Dr. Loenenbach is a senior scientist at the Robert Koch Institute, Berlin, Germany. Her research interests include investigation of infectious disease outbreaks, general field epidemiology, and epidemiology of infectious respiratory diseases.
Author contributions: A.L., B.B., A.S.L., P.P., and U.B. conceptualized and designed the study; A.L., A.S.L., P.P., B.B., S.A., S.B., M.D., R.D., T.G., M.H., K.P., J.S., M.W., and U.B. performed data collection; A.L., A.S.L., P.P., M.H., and U.B. performed data analysis; A.L., A.S.L., P.P., B.B., S.A., S.B., M.D., R.D., T.G., W.H., M.H., K.P., J.S., M.W., and U.B. performed data interpretation; A.L. and U.B. prepared the original manuscript draft; A.L., A.S.L., P.P., M.H., and U.B. performed data analysis; A.L., A.S.L., P.P., B.B., S.A., S.B., M.D., R.D., T.G., W.H., M.H., K.P., J.S., M.W., and U.B. reviewed and revised the manuscript; and U.B. supervised the project.
Acknowledgments
We thank all participants who contributed to GrippeWeb, primary care sentinel physicians participating in the virologic sentinel, local health authorities for notification data, and wastewater facilities for providing data. We thank all staff members of the acute respiratory infections team at the Respiratory Infections Unit at Robert Koch Institute, as well as all staff members at the National Influenza Centre. We thank Romy Kerber for providing detailed information on the different SARS-CoV-2 variant phases in Germany. We also thank the Federal Ministry of Health for funding wastewater surveillance by the project Abwassermonitoring für die epidemiologische Lagebewertung (AMELAG) until the end of 2024. Finally, we are indebted to Ulrike Braun, Marcus Lukas, and all wastewater treatment plants, laboratories, universities, and state authorities involved in the AMELAG project.
Data and code can be accessed at https://github.com/peterpuetz2020/extent_of_underestimation.
References
- Bayer C, Remschmidt C, an der Heiden M, Tolksdorf K, Herzhoff M, Kaersten S, et al. Internet-based syndromic monitoring of acute respiratory illness in the general population of Germany, weeks 35/2011 to 34/2012. Euro Surveill. 2014;19:20684. DOIPubMedGoogle Scholar
- Goerlitz L, Tolksdorf K, Buchholz U, Prahm K, Preuß U, An der Heiden M, et al. [Monitoring of COVID-19 by extending existing surveillance for acute respiratory infections] [in German]. Bundesgesundheitsblatt Gesundheitsforschung Gesundheitsschutz. 2021;64:395–402. DOIPubMedGoogle Scholar
- Buchholz U, Lehfeld AS, Tolksdorf K, Cai W, Reiche J, Biere B, et al. Respiratory infections in children and adolescents in Germany during the COVID-19 pandemic. J Health Monit. 2023;8:20–38.PubMedGoogle Scholar
- Oh DY, Buda S, Biere B, Reiche J, Schlosser F, Duwe S, et al. Trends in respiratory virus circulation following COVID-19-targeted nonpharmaceutical interventions in Germany, January - September 2020: Analysis of national surveillance data. Lancet Reg Health Eur. 2021;6:
100112 . DOIPubMedGoogle Scholar - Cleveland WS, Devlin SJ. Locally weighted regression: an approach to regression analysis by local fitting. J Am Stat Assoc. 1988;83:596–610. DOIGoogle Scholar
- Robert Koch Institute (RKI). Wastewater-based surveillance on SARS-CoV-2. AMELAG weekly report 2024 Feb 21 [cited 2024 Feb 23]. https://www.rki.de/EN/Content/Institute/DepartmentsUnits/InfDiseaseEpidem/Div32/WastewaterSurveillance/Report.html
- Muggeo VM. Estimating regression models with unknown break-points. Stat Med. 2003;22:3055–71. DOIPubMedGoogle Scholar
- Muggeo VM. Segmented: an R package to fit regression models with broken-line relationships. R News. 2008;8:20–5.
- Bartig S, Beese F, Wachtler B, Grabka MM, Mercuri E, Schmid L, et al. Socioeconomic differences in SARS-CoV-2 infection and vaccination in Germany: a seroepidemiological study after one year of COVID-19 vaccination campaign. Int J Public Health. 2023;68:
1606152 . DOIPubMedGoogle Scholar - Offergeld R, Preußel K, Zeiler T, Aurich K, Baumann-Baretti BI, Ciesek S, et al. Monitoring the SARS-CoV-2 pandemic: prevalence of antibodies in a large, repetitive cross-sectional study of blood donors in Germany—results from the SeBluCo Study 2020–2022. Pathogens. 2023;12:551. DOIPubMedGoogle Scholar
- Skowronski DM, Kaweski SE, Irvine MA, Kim S, Chuang ESY, Sabaiduc S, et al. Serial cross-sectional estimation of vaccine-and infection-induced SARS-CoV-2 seroprevalence in British Columbia, Canada. CMAJ. 2022;194:E1599–609. DOIPubMedGoogle Scholar
- McKenzie L, Shoukat A, Wong KO, Itahashi K, Yasuda E, Demarsh A, et al. Inferring the true number of SARS-CoV-2 infections in Japan. J Infect Chemother. 2022;28:1519–22. DOIPubMedGoogle Scholar
- Noh J, Danuser G. Estimation of the fraction of COVID-19 infected people in U.S. states and countries worldwide. PLoS One. 2021;16:
e0246772 . DOIPubMedGoogle Scholar - Reese H, Iuliano AD, Patel NN, Garg S, Kim L, Silk BJ, et al. Estimated incidence of coronavirus disease 2019 (COVID-19) illness and hospitalization—United States, February–September 2020. Clin Infect Dis. 2021;72:e1010–7. DOIPubMedGoogle Scholar
- World Health Organization (WHO). Crafting the mosaic framework for resilient surveillance for respiratory viruses of epidemic and pandemic potential. Geneva: The Organization; 2023 [cited 2023 Dec 30]. https://www.who.int/publications/i/item/9789240070288
Figure
Table
Cite This ArticleOriginal Publication Date: August 14, 2024
1These first authors contributed equally to this article.
Table of Contents – Volume 30, Number 9—September 2024
| EID Search Options |
|---|
|
|
|
|
|
|
Please use the form below to submit correspondence to the authors or contact them at the following address:
Udo Buchholz, Robert Koch Institute, Department for Infectious Disease Epidemiology, Seestraße 10, Berlin 13353, Germany
Top