Volume 31, Number 1—January 2025
Research
Ongoing Evolution of Middle East Respiratory Syndrome Coronavirus, Saudi Arabia, 2023–2024
Ahmed M. Hassan1, Barbara Mühlemann1, Tagreed L. Al-Subhi, Jordi Rodon, Sherif A. El-Kafrawy, Ziad Memish, Julia Melchert, Tobias Bleicker, Tiina Mauno, Stanley Perlman, Alimuddin Zumla, Terry C. Jones, Marcel A. Müller, Victor M. Corman, Christian Drosten2 , and Esam I. Azhar2
Figure 3
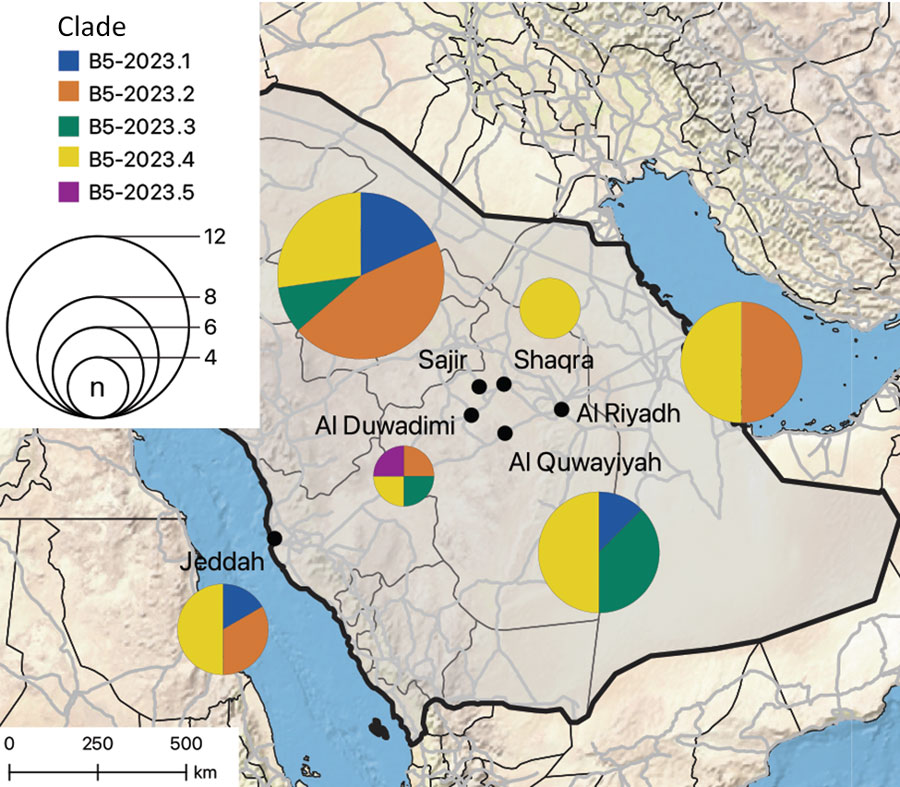
Figure 3. Spatial distribution of B5-2023.1–5 subclades in study of ongoing evolution of Middle East respiratory syndrome coronavirus, Saudi Arabia, 2023–2024. Pie charts show the number of sequences from each subclade found at each of the 6 sampling sites (indicated by black circles on the map) in Saudi Arabia; size of the pie chart corresponds to the number of sequences. Thin black lines indicate administrative regions; gray lines indicate roads. Map was generated by using QGIS v3.28 (https://www.qgis.org).
1These first authors contributed equally to this article.
2These senior authors contributed equally to this article.
Page created: October 30, 2024
Page updated: December 22, 2024
Page reviewed: December 22, 2024
The conclusions, findings, and opinions expressed by authors contributing to this journal do not necessarily reflect the official position of the U.S. Department of Health and Human Services, the Public Health Service, the Centers for Disease Control and Prevention, or the authors' affiliated institutions. Use of trade names is for identification only and does not imply endorsement by any of the groups named above.