Effects of Decentralized Sequencing on National Listeria monocytogenes Genomic Surveillance, Australia, 2016–2023
Patiyan Andersson, Sally Dougall, Karolina Mercoulia, Kristy A. Horan, Torsten Seemann, Jake A. Lacey, Tuyet Hoang, Lex E.X. Leong, David Speers, Louise Cooley, Karina Kennedy, Rob Baird, Rikki Graham, Qinning Wang, Avram Levy, Dimitrios Menouhos, Norelle L. Sherry, Susan A. Ballard, Vitali Sintchenko, Amy V. Jennison, and Benjamin P. Howden

Author affiliation: The University of Melbourne, Melbourne, Victoria, Australia (P. Andersson, S. Dougall, K. Mercoulia, K.A. Horan, T. Seeman, J.A. Lacey, T. Hoang, N.L. Sherry, S.A. Ballard, B.P. Howden); SA Pathology, Adelaide, South Australia, Australia (L.E.X. Leong); Queen Elizabeth II Medical Centre, Perth, Western Australia, Australia (D. Speers, A. Levy); Royal Hobart Hospital, Hobart, Tasmania, Australia (L. Cooley); Canberra Health Services, Australian National University Medical School, Canberra, Australian Capital Territory, Australia (K. Kennedy); Territory Pathology, Royal Darwin Hospital, Darwin, Northern Territory, Australia (R. Baird, D. Menouhos); Queensland Public Health and Scientific Services, Queensland Health, Brisbane, Queensland, Australia (R. Graham, A.V. Jennison); Institute of Clinical Pathology and Medical Research, NSW Health Pathology, Sydney, New South Wales, Australia (Q. Wang, V. Sintchenko); Austin Health, Heidelberg, Victoria, Australia (N.L. Sherry, B.P. Howden); Sydney Institute for Infectious Diseases, The University of Sydney, Sydney (V. Sintchenko)
Main Article
Figure 3
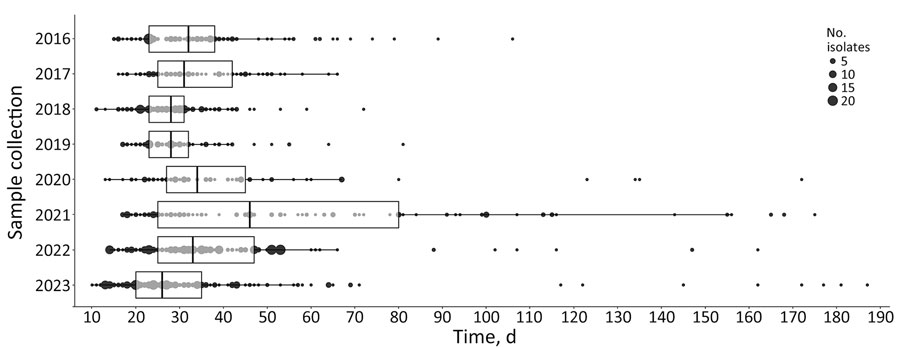
Figure 3. Box and whisker representation of end-to-end timeliness in a study of effects of decentralized sequencing on national Listeria monocytogenes genomic surveillance, Australia, 2016–2023. Time represents date of sample collection to date genomic surveillance report was issued, by year. Boxplots show medians (vertical lines within boxes), first and third quartiles (box left and right edges), and 1.5× interquartile range from each quartile (whiskers); points outside that range are considered outliers. Underlying data are shown as dots, and dot size corresponds to the number of samples at each timepoint. Statistically significant differences (p<0.001) between the years were calculated by using Kruskal-Wallis χ2 test. Dunn’s posthoc test showed statistically significant (p<0.001) increases in times for years 2020 and 2021, compared with previous years (p = 0.029), and subsequent significant decreases in times in 2022 and 2023 (adjusted p<0.001). Median time in 2023 was 26 days, compared with a median of 32 days in 2016.
Main Article
Page created: April 01, 2025
Page updated: May 12, 2025
Page reviewed: May 12, 2025
The conclusions, findings, and opinions expressed by authors contributing to this journal do not necessarily reflect the official position of the U.S. Department of Health and Human Services, the Public Health Service, the Centers for Disease Control and Prevention, or the authors' affiliated institutions. Use of trade names is for identification only and does not imply endorsement by any of the groups named above.