Skip directly to site content Skip directly to page options Skip directly to A-Z link Skip directly to A-Z link Skip directly to A-Z link

Disclaimer: Early release articles are not considered as final versions. Any changes will be reflected in the online version in the month the article is officially released.

Volume 31, Number 3—March 2025
Dispatch

Extended-Spectrum β-Lactamase–Producing Enterobacterales in Municipal Wastewater Collections, Switzerland, 2019–2023

Lisandra Aguilar-Bultet1, Elena Gómez-Sanz1, Ana B. García-Martín, Monica Alt Hug, Reto Furger, Lucas Eichenberger, Claudia Bagutti2, and Sarah Tschudin-Sutter2Comments to Author 
Author affiliation: University Hospital Basel, Basel, Switzerland (L. Aguilar-Bultet, E. Gómez-Sanz, Ana B. García-Martín, S. Tschudin-Sutter); State Laboratory Basel-City, Basel (M.A. Hug, R. Furger, L. Eichenberger, C. Bagutti)

Main Article

Figure

Temporal quantification of extended-spectrum β-lactamase–producing Enterobacterales in municipal wastewater collections, Switzerland, 2019–2023. A–C) Temporal distribution of presumptive ESBL-producing Escherichia coli (A), presumptive ESBL-producing KESC (B), and presumptive ESBL-producing E. coli plus KESC (C). Data from the 3-month sampling across the 21 sampling points distributed across Basel, Switzerland (representing 44% of the Basel population), are collapsed and represented by year: 2019, n = 63; 2021, n = 62; 2023, n = 63. Friedman test p values for all categories are <0.001. Quantification stratified by sample source. D–F) Temporal distribution by source, urban or mixed (community and hospital) effluents, of presumptive ESBL-producing E. coli (D) presumptive ESBL-producing KESC (E), and presumptive ESBL-producing E. coli plus KESC (F). Data from the 3-month sampling across the 17 urban (n = 51 per year) and 4 mixed (n = 12 per year, except for 1 data point missing in April 2021) sampling points are combined and represented per year. Box tops and bottoms indicate interquartile ranges; bold lines, medians; whiskers, 1.5 times the interquartile range. Jitter plots indicate individual data points. Outliers were removed for readability. Mann-Whitney sum U test p values stratified by mixed versus urban samples per chromogenic group (per year): E. coli, p = 0.654 (2019), 0.107 (2021), 0.371 (2023); KESC: 0.420 (2019), 0.179 (2021), 0.0251 (2023); E. coli plus KESC, p = 0.531 (2019), 0.283 (2021), 0.128 (2023). ESBL extended-spectrum β-lactamase; ESBL-PE, extended-spectrum β-lactamase–producing Enterobacterales; KESC, Klebsiella, Enterobacter, Serratia, and Citrobacter.

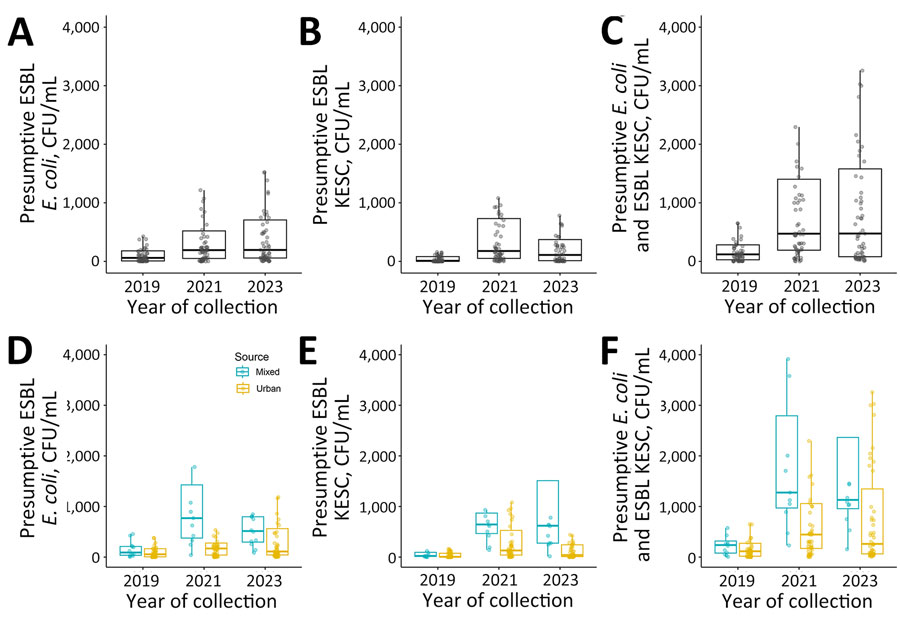
Figure. Temporal quantification of extended-spectrum β-lactamase–producing Enterobacterales in municipal wastewater collections, Switzerland, 2019–2023. A–C) Temporal distribution of presumptive ESBL-producing Escherichia coli (A), presumptive ESBL-producing KESC (B), and presumptive ESBL-producing E. coli plus KESC (C). Data from the 3-month sampling across the 21 sampling points distributed across Basel, Switzerland (representing 44% of the Basel population), are collapsed and represented by year: 2019, n = 63; 2021, n = 62; 2023, n = 63. Friedman test p values for all categories are <0.001. Quantification stratified by sample source. D–F) Temporal distribution by source, urban or mixed (community and hospital) effluents, of presumptive ESBL-producing E. coli (D) presumptive ESBL-producing KESC (E), and presumptive ESBL-producing E. coli plus KESC (F). Data from the 3-month sampling across the 17 urban (n = 51 per year) and 4 mixed (n = 12 per year, except for 1 data point missing in April 2021) sampling points are combined and represented per year. Box tops and bottoms indicate interquartile ranges; bold lines, medians; whiskers, 1.5 times the interquartile range. Jitter plots indicate individual data points. Outliers were removed for readability. Mann-Whitney sum U test p values stratified by mixed versus urban samples per chromogenic group (per year): E. coli, p = 0.654 (2019), 0.107 (2021), 0.371 (2023); KESC: 0.420 (2019), 0.179 (2021), 0.0251 (2023); E. coli plus KESC, p = 0.531 (2019), 0.283 (2021), 0.128 (2023). ESBL extended-spectrum β-lactamase; ESBL-PE, extended-spectrum β-lactamase–producing Enterobacterales; KESC, Klebsiella, Enterobacter, Serratia, and Citrobacter.

Main Article

1These first authors contributed equally to this article.

2These senior authors contributed equally to this article.

Page created: February 04, 2025
Page updated: February 21, 2025
Page reviewed: February 21, 2025
The conclusions, findings, and opinions expressed by authors contributing to this journal do not necessarily reflect the official position of the U.S. Department of Health and Human Services, the Public Health Service, the Centers for Disease Control and Prevention, or the authors' affiliated institutions. Use of trade names is for identification only and does not imply endorsement by any of the groups named above.
file_external