Volume 31, Number 6—June 2025
Research
Emergence of Oropouche Virus in Espírito Santo State, Brazil, 2024
Edson Delatorre , Gabriela Colombo de Mendonça, Felipe Donateli Gatti, Anna Clara Gregório Có, Julia del Piero Pereira, Eric Arrivabene Tavares, Joana Zorzal Nodari, Agata Rossi, Suwellen Sardinha Dias de Azevedo, Cláudio Tavares Sacchi, Karoline Rodrigues Campos, Adriana Bugno, Lyvia Neves Rebello Alves, Lucas André Silva Bonela, Jaqueline Pegoretti Goulart, Thiago de Jesus Sousa, Felipe Gomes Naveca, and Rodrigo Ribeiro-Rodrigues
Figure 2
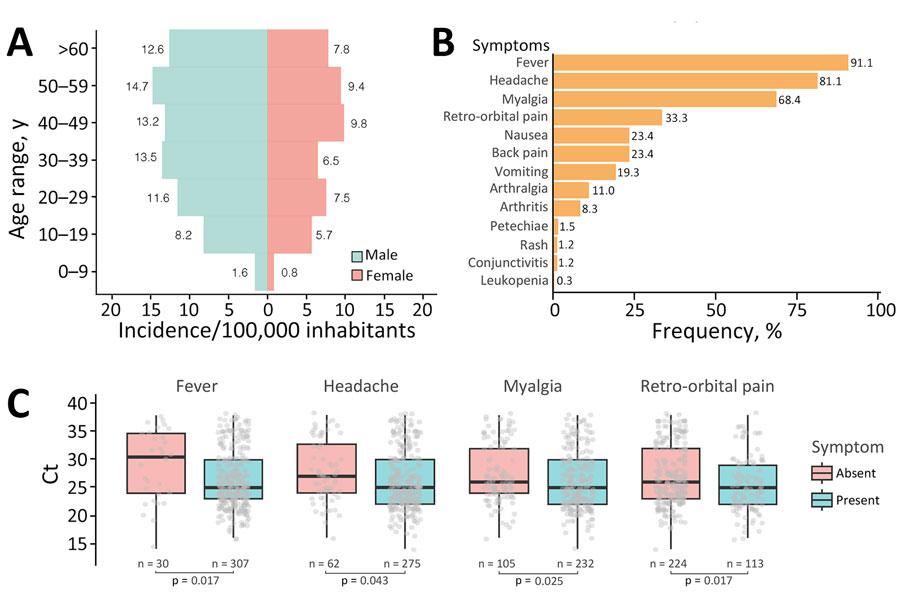
Figure 2. Demographics, symptoms, and Ct value comparison in OROV-positive patients from Espírito Santo, Brazil. A) Age-sex pyramid of the OROV incidence rate (per 100,000 inhabitants). Incidence rates are shown for each age group. B) Frequency of symptoms reported in OROV-positive patients. C) Boxplots of Ct values from OROV reverse transcription PCR in patients with or without fever, headache, myalgia, and retroorbital pain. Black horizontal bars indicate medians, tops and bottoms of boxes indicate interquartile ranges, vertical whiskers indicate ranges. Gray dots represent individual Ct values. p values determined by 2-sided Mann–Whitney U test for each comparison.
Page created: May 01, 2025
Page updated: May 27, 2025
Page reviewed: May 27, 2025
The conclusions, findings, and opinions expressed by authors contributing to this journal do not necessarily reflect the official position of the U.S. Department of Health and Human Services, the Public Health Service, the Centers for Disease Control and Prevention, or the authors' affiliated institutions. Use of trade names is for identification only and does not imply endorsement by any of the groups named above.