Volume 31, Number 6—June 2025
Research
Emergence of Oropouche Virus in Espírito Santo State, Brazil, 2024
Edson Delatorre , Gabriela Colombo de Mendonça, Felipe Donateli Gatti, Anna Clara Gregório Có, Julia del Piero Pereira, Eric Arrivabene Tavares, Joana Zorzal Nodari, Agata Rossi, Suwellen Sardinha Dias de Azevedo, Cláudio Tavares Sacchi, Karoline Rodrigues Campos, Adriana Bugno, Lyvia Neves Rebello Alves, Lucas André Silva Bonela, Jaqueline Pegoretti Goulart, Thiago de Jesus Sousa, Felipe Gomes Naveca, and Rodrigo Ribeiro-Rodrigues
Figure 3
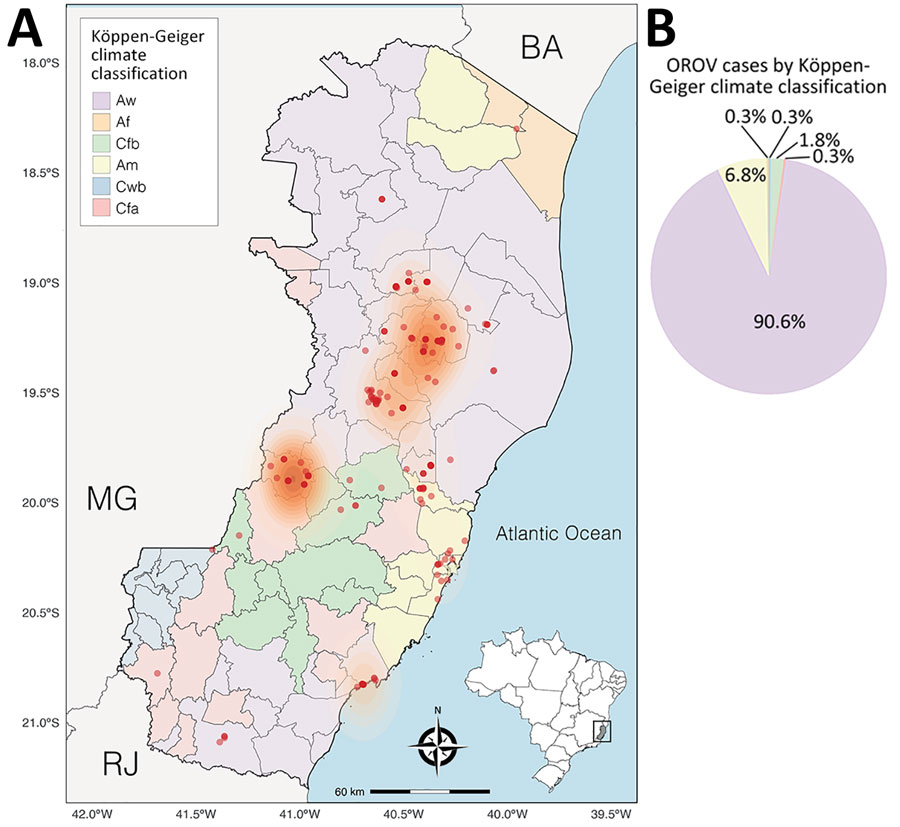
Figure 3. Spatial distribution of Oropouche virus cases and climate classification in Espírito Santo, Brazil. A) Espírito Santo, with municipalities colored according to the Köppen-Geiger climate classification. Red dots indicate cases. Orange shading represents case density. Inset shows location of Espírito Santo state in Brazil. B) Pie chart showing the percentage of cases in each Köppen-Geiger climate category.
Page created: May 01, 2025
Page updated: May 27, 2025
Page reviewed: May 27, 2025
The conclusions, findings, and opinions expressed by authors contributing to this journal do not necessarily reflect the official position of the U.S. Department of Health and Human Services, the Public Health Service, the Centers for Disease Control and Prevention, or the authors' affiliated institutions. Use of trade names is for identification only and does not imply endorsement by any of the groups named above.