Volume 31, Number 6—June 2025
Research
Diagnostic Accuracy of 3 Mpox Lateral Flow Assays for Antigen Detection, Democratic Republic of the Congo and United Kingdom
Elie Ishara-Nshombo1 , Anushri Somasundaran1, Alessandra Romero-Ramirez, Konstantina Kontogianni, Daniel Mukadi-Bamuleka, Marithé Mukoka-Ntumba, Emile Muhindo-Milonde, Hugues Mirimo-Nguee, Jacob Parkes, Yusra Hussain, Susan Gould, Christopher T. Williams, Dominic Wooding, Juvenal Nkeramahame, Mikaela Watson, Hayley E. Hardwick, Malcolm G. Semple, John Kenneth Baillie, Jake Dunning, Thomas E. Fletcher, Thomas Edwards, Devy M. Emperador, Hugo Kavunga-Membo1, Ana Isabel Cubas-Atienzar1 , and ISARIC 4 and C Investigators,2
Figure 1
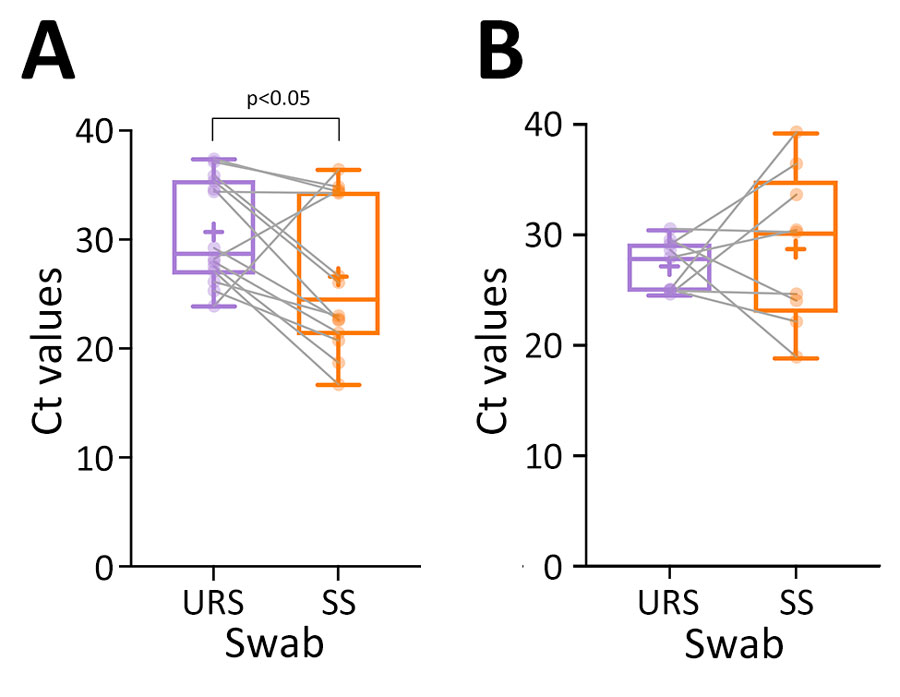
Figure 1. Boxplots of Ct values from paired URS and SS tested by Sansure quantitative PCR in study of diagnostic accuracy of 3 mpox lateral flow assays for antigen detection, Democratic Republic of the Congo (DRC) and United Kingdom. A) DRC, n = 14; B) United Kingdom, n = 9. Horizontal lines within boxes indicate medians, box tops and bottoms indicate interquartile range, and whiskers indicate maximum and minimum values. Ct values were significantly higher (p<0.05) in the URS group than in the SS group in the DRC cohort. Ct, cycle threshold; SS, skin lesion samples; URS, upper respiratory specimens.
1These authors contributed equally to this article.
2Members of ISARIC 4C investigator group are listed at the end of this article.
Page created: April 08, 2025
Page updated: May 27, 2025
Page reviewed: May 27, 2025
The conclusions, findings, and opinions expressed by authors contributing to this journal do not necessarily reflect the official position of the U.S. Department of Health and Human Services, the Public Health Service, the Centers for Disease Control and Prevention, or the authors' affiliated institutions. Use of trade names is for identification only and does not imply endorsement by any of the groups named above.