Volume 31, Number 7—July 2025
Research
Estimation of Incubation Period for Oropouche Virus Disease among Travel-Associated Cases, 2024–2025
Sarah Anne J. Guagliardo , Stacey Martin, Carolyn V. Gould, Rebekah Sutter, Daniel Jacobs, Kevin O’Laughlin, Ralph Huits, Concetta Castilletti, J. Erin Staples, and GeoSentinel Network Collaborators1
Figure 2
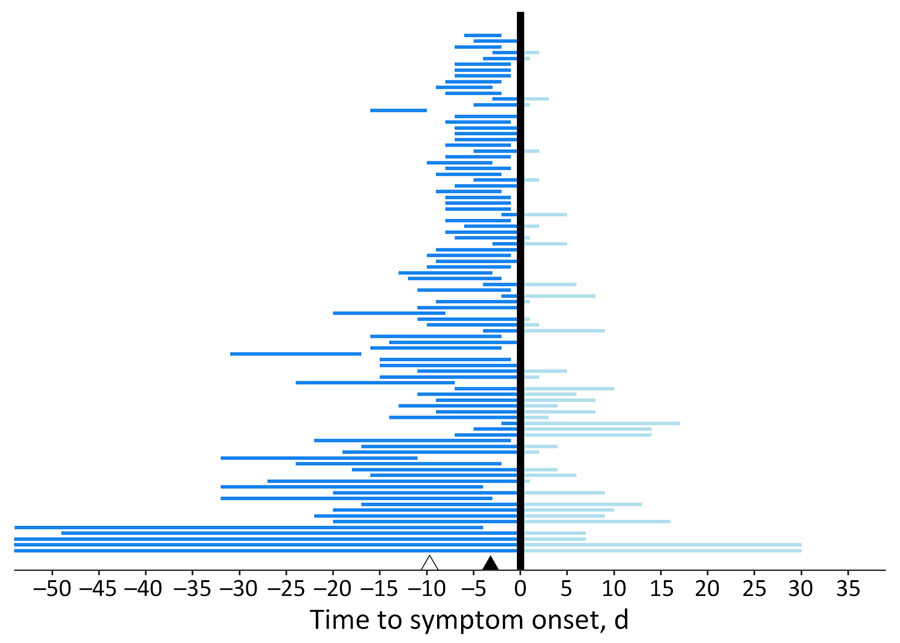
Figure 2. Time of exposure relative to symptom onset in an estimation of incubation period for Oropouche virus disease among 97 probable and confirmed travel-associated cases, 2024–2025. Each horizontal line corresponds to an individual patient’s exposure time. The vertical black line represents symptom onset. The horizontal lines represent the exposure durations before (dark blue) and after (light blue) symptom onset. Observations are ordered by duration of travel, and long travel durations are truncated from the graph for ease of interpretation. The black triangle represents the median incubation period for probable and confirmed cases; the white triangle represents the 95th quantile.
1Members are listed at the end of this article.
Page created: April 30, 2025
Page updated: June 25, 2025
Page reviewed: June 25, 2025
The conclusions, findings, and opinions expressed by authors contributing to this journal do not necessarily reflect the official position of the U.S. Department of Health and Human Services, the Public Health Service, the Centers for Disease Control and Prevention, or the authors' affiliated institutions. Use of trade names is for identification only and does not imply endorsement by any of the groups named above.