Volume 31, Number 7—July 2025
Research
Estimation of Incubation Period for Oropouche Virus Disease among Travel-Associated Cases, 2024–2025
Sarah Anne J. Guagliardo , Stacey Martin, Carolyn V. Gould, Rebekah Sutter, Daniel Jacobs, Kevin O’Laughlin, Ralph Huits, Concetta Castilletti, J. Erin Staples, and GeoSentinel Network Collaborators1
Figure 3
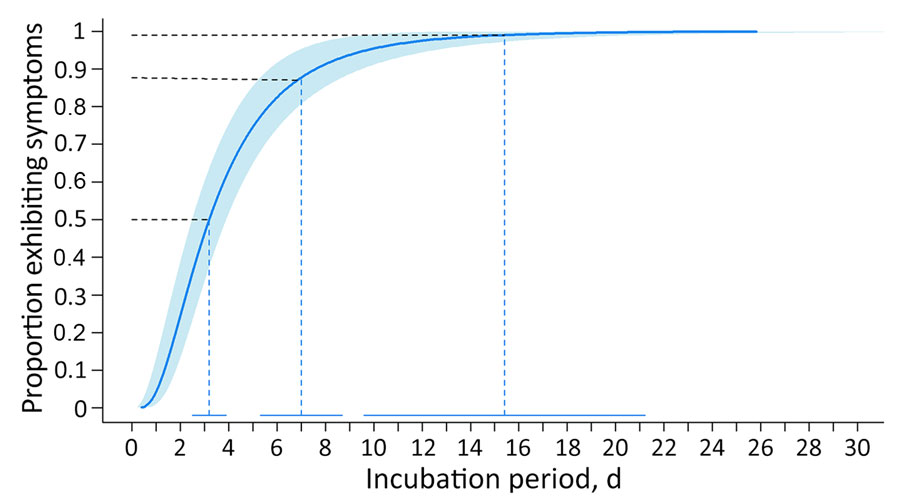
Figure 3. Estimated cumulative distribution of incubation period for Oropouche virus disease among 97 probable and confirmed travel-associated cases, 2024–2025. Solid blue line represents the estimated log-normal cumulative distribution function; shaded area represents 95% CI. Dashed lines correspond to the 50th and 99th quantiles, in addition to the proportion of patients that experienced symptoms within 1 week (88th quantile). The solid horizontal lines at bottom represent the 95% CIs for the quantiles.
1Members are listed at the end of this article.
Page created: April 30, 2025
Page updated: June 25, 2025
Page reviewed: June 25, 2025
The conclusions, findings, and opinions expressed by authors contributing to this journal do not necessarily reflect the official position of the U.S. Department of Health and Human Services, the Public Health Service, the Centers for Disease Control and Prevention, or the authors' affiliated institutions. Use of trade names is for identification only and does not imply endorsement by any of the groups named above.