Skip directly to site content Skip directly to page options Skip directly to A-Z link Skip directly to A-Z link Skip directly to A-Z link

Disclaimer: Early release articles are not considered as final versions. Any changes will be reflected in the online version in the month the article is officially released.

Volume 31, Number 8—August 2025

Research

Estimated COVID-19 Periodicity and Correlation with SARS-CoV-2 Spike Protein S1 Antigenic Diversity, United States

Erica Billig RoseComments to Author , Clinton R. Paden, Peter W. Cook, Kevin C. Ma, Amber Winn, Juan Castro, Lakshmi Panagiotakopoulos, and Benjamin J. Silk
Author affiliation: Centers for Disease Control and Prevention, Atlanta, Georgia, USA

Main Article

Figure 2

National smoothed (3-week) percentages of positive SARS-CoV-2 tests reported to the National Respiratory and Enteric Surveillance System (NREVSS), United States, October 2020–September 2024. Data represent SARS-CoV-2 nucleic acid amplification test results, which include reverse transcription PCR tests from the NREVSS sentinel network of laboratories in the United States, including clinical, public health, and commercial laboratories. These data exclude antigen, antibody, and at-home test results. A) Periodogram, in which the height of each point indicates strength of the periodicity at the corresponding frequency. Dots indicate 5 dominant periodicities, at frequencies corresponding to surges every 104.5, 52.2, 26.1, 20.9, and 17.4 weeks. Weeks represent time intervals (i.e., weeks do not represent a year of calendar time in the context of this analysis). B) Fitted harmonic function using the 52.2- and 26.1-week periodicities determined by discrete Fourier transform (green line). C) Fitted harmonic function using the 104.5-, 52.2-, 26.1-, 20.9-, and 17.4-week periodicities determined by discrete Fourier transform (pink line).

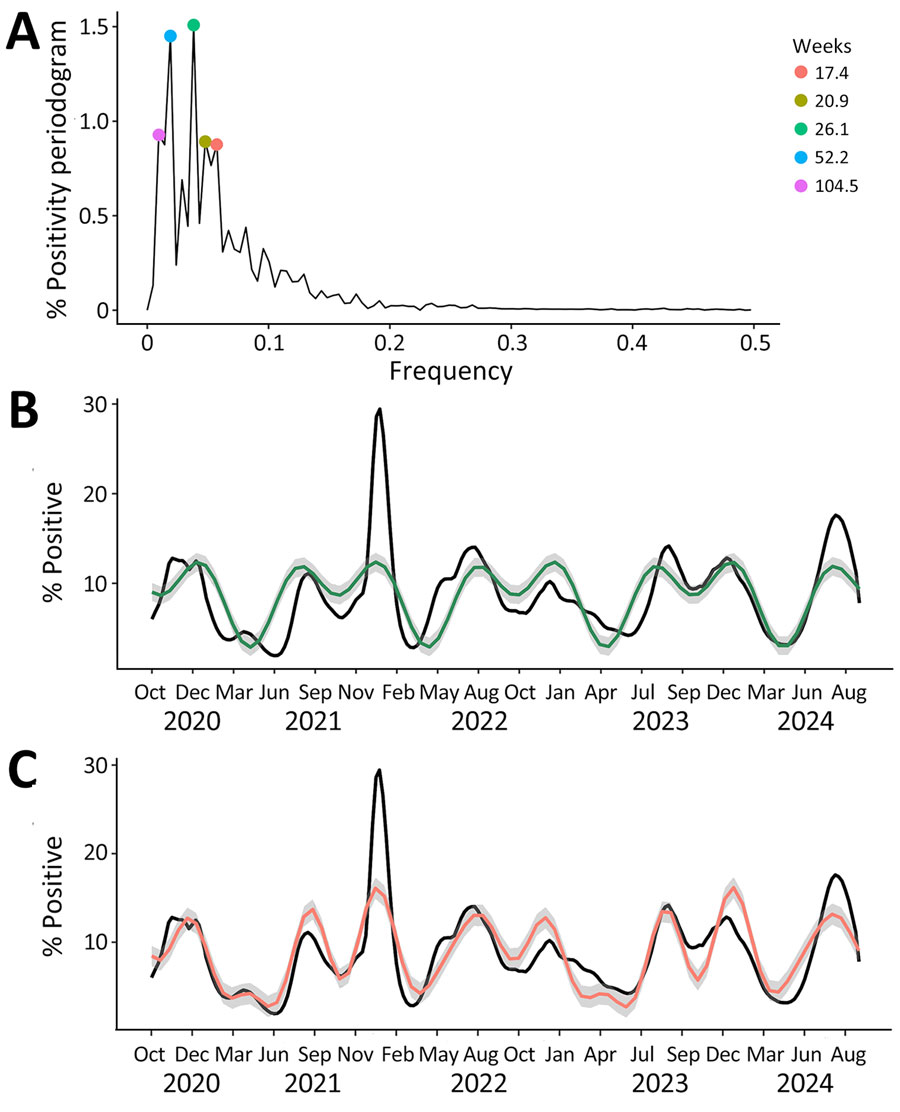
Figure 2. National smoothed (3-week) percentages of positive SARS-CoV-2 tests reported to the National Respiratory and Enteric Surveillance System (NREVSS), United States, October 2020–September 2024. Data represent SARS-CoV-2 nucleic acid amplification test results, which include reverse transcription PCR tests from the NREVSS sentinel network of laboratories in the United States, including clinical, public health, and commercial laboratories. These data exclude antigen, antibody, and at-home test results. A) Periodogram, in which the height of each point indicates strength of the periodicity at the corresponding frequency. Dots indicate 5 dominant periodicities, at frequencies corresponding to surges every 104.5, 52.2, 26.1, 20.9, and 17.4 weeks. Weeks represent time intervals (i.e., weeks do not represent a year of calendar time in the context of this analysis). B) Fitted harmonic function using the 52.2- and 26.1-week periodicities determined by discrete Fourier transform (green line). C) Fitted harmonic function using the 104.5-, 52.2-, 26.1-, 20.9-, and 17.4-week periodicities determined by discrete Fourier transform (pink line).

Main Article

Page created: June 18, 2025
Page updated: July 10, 2025
Page reviewed: July 10, 2025
The conclusions, findings, and opinions expressed by authors contributing to this journal do not necessarily reflect the official position of the U.S. Department of Health and Human Services, the Public Health Service, the Centers for Disease Control and Prevention, or the authors' affiliated institutions. Use of trade names is for identification only and does not imply endorsement by any of the groups named above.
file_external