Volume 31, Number 8—August 2025
Research
Estimated COVID-19 Periodicity and Correlation with SARS-CoV-2 Spike Protein S1 Antigenic Diversity, United States
Figure 3
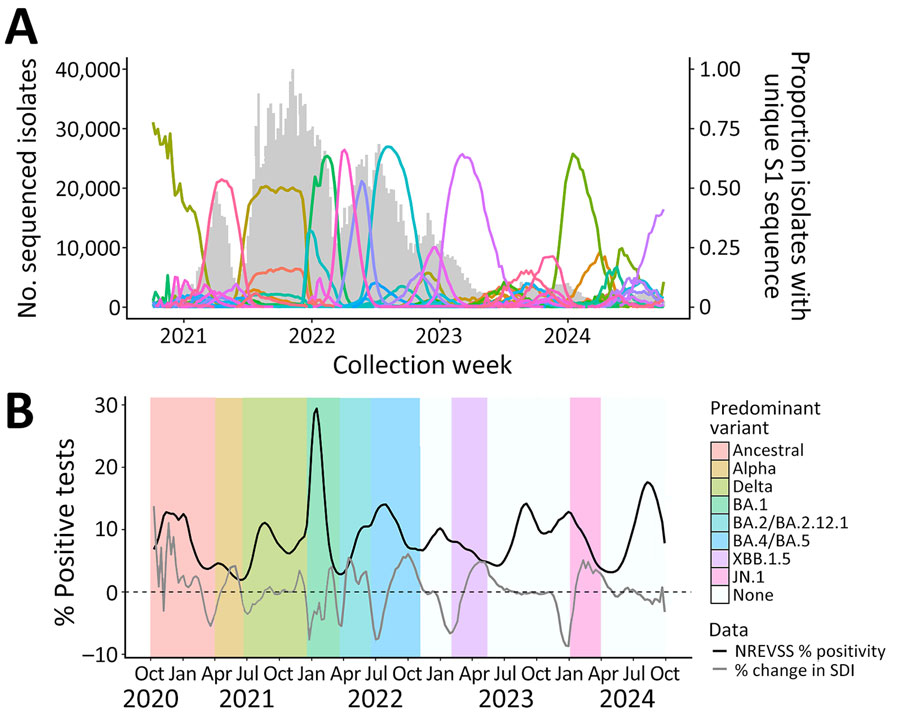
Figure 3. Weekly numbers of sequenced SARS-CoV-2 isolates, proportions with unique S1 spike sequences, and national percentages of positive SARS-CoV-2 tests and percentage changes in SDI, United States, October 2020–September 2024. A) Numbers of sequenced isolates (gray bars) and proportions of isolates with each unique S1 sequence (colored lines). Unique S1 sequences with a maximum proportion of <0.02 during the study period are included in the total number of isolates but not shown as proportion lines to improve visibility of patterns. B) National smoothed (3-week) percentages of positive SARS-CoV-2 tests reported to the NREVSS and percentage changes in SDI of S1 spike proteins. NREVSS, National Respiratory and Enteric Surveillance System; SDI, Simpson diversity index.