Skip directly to site content Skip directly to page options Skip directly to A-Z link Skip directly to A-Z link Skip directly to A-Z link

Disclaimer: Early release articles are not considered as final versions. Any changes will be reflected in the online version in the month the article is officially released.

Volume 31, Number 8—August 2025

Research

Estimated COVID-19 Periodicity and Correlation with SARS-CoV-2 Spike Protein S1 Antigenic Diversity, United States

Erica Billig RoseComments to Author , Clinton R. Paden, Peter W. Cook, Kevin C. Ma, Amber Winn, Juan Castro, Lakshmi Panagiotakopoulos, and Benjamin J. Silk
Author affiliation: Centers for Disease Control and Prevention, Atlanta, Georgia, USA

Main Article

Figure 1

Weekly smoothed (3-week) percentages of positive SARS-CoV-2 tests reported to the National Respiratory and Enteric Surveillance System (NREVSS), nationally and by Health and Human Services (HHS) Region, United States, October 2020–September 2024. The data represent SARS-CoV-2 nucleic acid amplification test results, which include reverse transcription PCR tests from the NREVSS sentinel network of laboratories in the United States, including clinical, public health, and commercial laboratories. These data exclude antigen, antibody, and at-home test results. Blue (December–February) and gray (July–September) vertical bands indicate time periods with increased percentage positivity. Seasonal peaks are indicated by dots at the week when smoothed percent positivity peaked. Regional colors are grouped by geography (e.g., Regions 1, 2, and 3 are shades of green and comprise the Northeast). All HHS Regions had 2 seasonal peaks a year, except HHS Region 8, which only had 1 peak between summer 2023 and winter 2023–2024. HHS Region 1: Connecticut, Maine, Massachusetts, New Hampshire, Rhode Island, and Vermont; HHS Region 2: New Jersey, New York, Puerto Rico, and the Virgin Islands; HHS Region 3: Delaware, District of Columbia, Maryland, Pennsylvania, Virginia, and West Virginia; HHS Region 4: Alabama, Florida, Georgia, Kentucky, Mississippi, North Carolina, South Carolina, and Tennessee; HHS Region 5: Illinois, Indiana, Michigan, Minnesota, Ohio, and Wisconsin; HHS Region 6: Arkansas, Louisiana, New Mexico, Oklahoma, and Texas; HHS Region 7: Iowa, Kansas, Missouri, and Nebraska; HHS Region 8: Colorado, Montana, North Dakota, South Dakota, Utah, and Wyoming; HHS Region 9: Arizona, California, Hawaii, Nevada, American Samoa, Commonwealth of the Northern Mariana Islands, Federated States of Micronesia, Guam, Marshall Islands, and Republic of Palau; HHS Region 10: Alaska, Idaho, Oregon, and Washington. Data from US-affiliated Pacific Islands are not included in NREVSS.

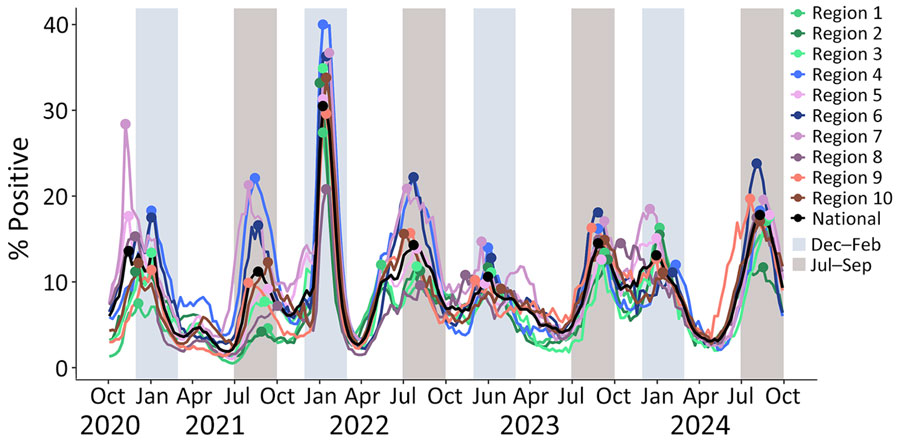
Figure 1. Weekly smoothed (3-week) percentages of positive SARS-CoV-2 tests reported to the National Respiratory and Enteric Surveillance System (NREVSS), nationally and by Health and Human Services (HHS) Region, United States, October 2020–September 2024. The data represent SARS-CoV-2 nucleic acid amplification test results, which include reverse transcription PCR tests from the NREVSS sentinel network of laboratories in the United States, including clinical, public health, and commercial laboratories. These data exclude antigen, antibody, and at-home test results. Blue (December–February) and gray (July–September) vertical bands indicate time periods with increased percentage positivity. Seasonal peaks are indicated by dots at the week when smoothed percent positivity peaked. Regional colors are grouped by geography (e.g., Regions 1, 2, and 3 are shades of green and comprise the Northeast). All HHS Regions had 2 seasonal peaks a year, except HHS Region 8, which only had 1 peak between summer 2023 and winter 2023–2024. HHS Region 1: Connecticut, Maine, Massachusetts, New Hampshire, Rhode Island, and Vermont; HHS Region 2: New Jersey, New York, Puerto Rico, and the Virgin Islands; HHS Region 3: Delaware, District of Columbia, Maryland, Pennsylvania, Virginia, and West Virginia; HHS Region 4: Alabama, Florida, Georgia, Kentucky, Mississippi, North Carolina, South Carolina, and Tennessee; HHS Region 5: Illinois, Indiana, Michigan, Minnesota, Ohio, and Wisconsin; HHS Region 6: Arkansas, Louisiana, New Mexico, Oklahoma, and Texas; HHS Region 7: Iowa, Kansas, Missouri, and Nebraska; HHS Region 8: Colorado, Montana, North Dakota, South Dakota, Utah, and Wyoming; HHS Region 9: Arizona, California, Hawaii, Nevada, American Samoa, Commonwealth of the Northern Mariana Islands, Federated States of Micronesia, Guam, Marshall Islands, and Republic of Palau; HHS Region 10: Alaska, Idaho, Oregon, and Washington. Data from US-affiliated Pacific Islands are not included in NREVSS.

Main Article

Page created: June 18, 2025
Page updated: July 10, 2025
Page reviewed: July 10, 2025
The conclusions, findings, and opinions expressed by authors contributing to this journal do not necessarily reflect the official position of the U.S. Department of Health and Human Services, the Public Health Service, the Centers for Disease Control and Prevention, or the authors' affiliated institutions. Use of trade names is for identification only and does not imply endorsement by any of the groups named above.
file_external