Skip directly to site content Skip directly to page options Skip directly to A-Z link Skip directly to A-Z link Skip directly to A-Z link

Disclaimer: Early release articles are not considered as final versions. Any changes will be reflected in the online version in the month the article is officially released.

Volume 31, Number 9—September 2025

Research

Detection of Multiple Nosocomial Trichosporon asahii Transmission Events via Microsatellite Typing Assay, South America

Elaine C. Francisco, Norma B. Fernández, Mauricio Carbia, Chendo Dieleman, Andra-Cristina Bostanaru-Iliescu, Jos Houbraken, Arnaldo L. Colombo, and Ferry HagenComments to Author 
Author affiliation: Westerdijk Fungal Biodiversity Institute, Utrecht, the Netherlands (E.C. Fancisco, C. Dieleman, J. Houbraken, F. Hagen); Escola Paulista de Medicina-Universidade Federal de São Paulo, São Paulo, Brazil (E.C. Francisco, A.L. Colombo); Hospital de Clínicas José de San Martín, Universidad de Buenos Aires, Buenos Aires, Argentina (N.B. Fernández); Instituto de Higiene, Facultad de Medicina, Universidad de la República, Montevideo, Uruguay (M. Carbia); Iași University of Life Sciences, Iasi, Romania (A.-C. Bostanaru-Iliescu); Antimicrobial Resistance Institute of São Paulo, São Paulo (A.L. Colombo); University Medical Center Utrecht, Utrecht (F. Hagen); Institute for Biodiversity and Ecosystem Dynamics, University of Amsterdam, Amsterdam, the Netherlands (F. Hagen)

Main Article

Figure 2

Phylogeny of multiple nosocomial Trichosporon asahii transmission events via microsatellite typing assay, South America. We compared IGS1 sequencing–based genotyping and a microsatellite panel for 111 T. asahii isolates. A) Neighbor-joining tree based on the rDNA sequencing target, conducted in MEGAX (https://www.megasoftware.net). Red text indicates GenBank accession numbers for reference strains of the described genotypes. Scale bar indicates nucleotide differences per site. B) Minimum spanning tree generated by 6 loci of microsatellite data showing the relationship between microsatellite typing and IGS1 genotypes. Each circle represents a unique genotype; if multiple isolates share an identical genotype, they are shown as a fraction of the circle. Lines between circles indicate the relative similarity, the shorter the line the less prominent the difference between the microsatellite genotypes. Thick lines identify genotypes with fewer differences (1 of 6 loci tested); medium thick lines identify genotypes with differences in 2 of the 6 loci; thick and medium thick dashed lines represent genotypes that share 2–3 identical loci of the 6 tested. Thin dotted lines identify genotypes sharing only 1 identical locus. IGS, intergenic spacer.

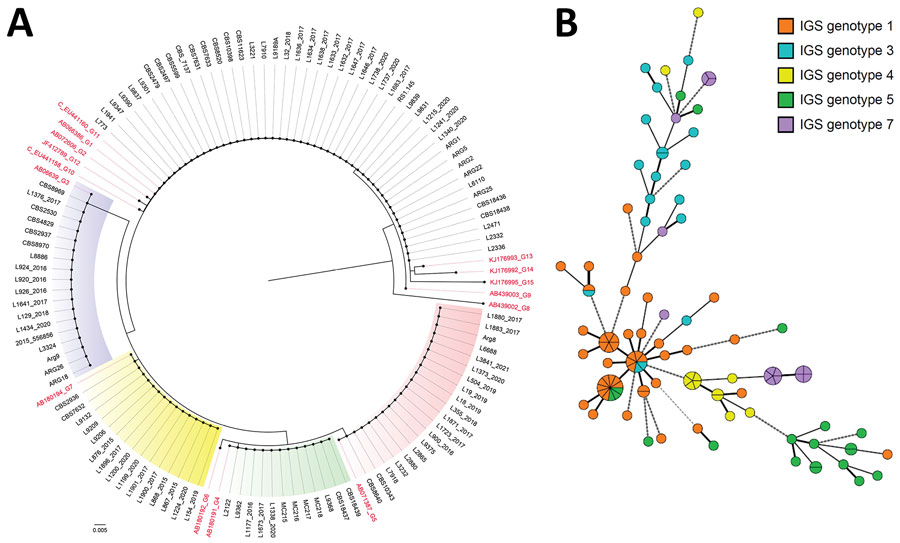
Figure 2. Phylogeny of multiple nosocomial Trichosporon asahii transmission events via microsatellite typing assay, South America. We compared IGS1 sequencing–based genotyping and a microsatellite panel for 111 T. asahii isolates. A) Neighbor-joining tree based on the rDNA sequencing target, conducted in MEGAX (https://www.megasoftware.net). Red text indicates GenBank accession numbers for reference strains of the described genotypes. Scale bar indicates nucleotide differences per site. B) Minimum spanning tree generated by 6 loci of microsatellite data showing the relationship between microsatellite typing and IGS1 genotypes. Each circle represents a unique genotype; if multiple isolates share an identical genotype, they are shown as a fraction of the circle. Lines between circles indicate the relative similarity, the shorter the line the less prominent the difference between the microsatellite genotypes. Thick lines identify genotypes with fewer differences (1 of 6 loci tested); medium thick lines identify genotypes with differences in 2 of the 6 loci; thick and medium thick dashed lines represent genotypes that share 2–3 identical loci of the 6 tested. Thin dotted lines identify genotypes sharing only 1 identical locus. IGS, intergenic spacer.

Main Article

Page created: June 18, 2025
Page updated: August 18, 2025
Page reviewed: August 18, 2025
The conclusions, findings, and opinions expressed by authors contributing to this journal do not necessarily reflect the official position of the U.S. Department of Health and Human Services, the Public Health Service, the Centers for Disease Control and Prevention, or the authors' affiliated institutions. Use of trade names is for identification only and does not imply endorsement by any of the groups named above.
file_external