Volume 32, Number 1—January 2026
Dispatch
Evidence of Rat Hepatitis E Virus Circulation through Wastewater Surveillance, Central Argentina
Bianca Filoni1 , María Emilia Lucero1, Guadalupe Di Cola, Anabella Fantilli, Alfonsina Roccia, Paola Sicilia, Liliana Luque, Ariana Cachi, María de los Ángeles Marinzalda, Gonzalo Castro, Gisela Masachessi, Viviana Ré, and María Belén Pisano
Figure 1
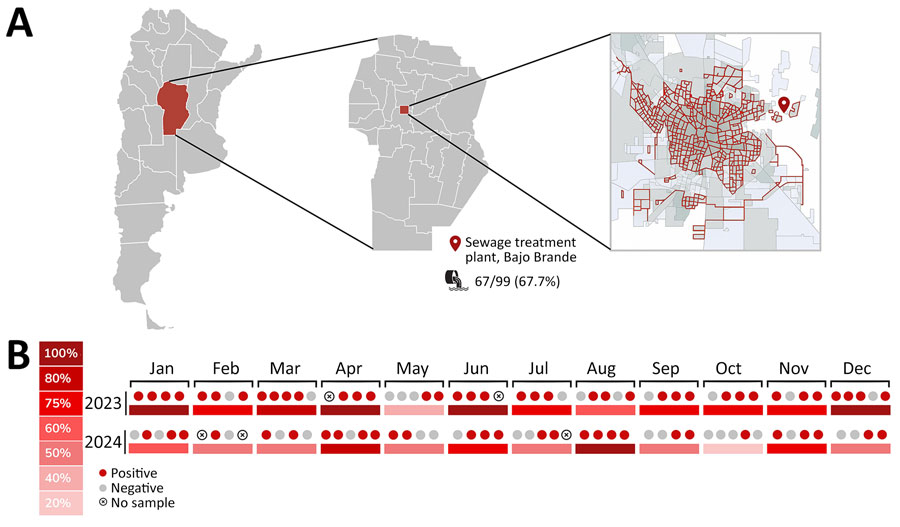
Figure 1. Emerging rat hepatitis E virus detection in Argentina, 2023–2024. A) Study area in the province of Córdoba (red shading), located in the central region of Argentina, and the location of Bajo Grande wastewater treatment plant in the city of Córdoba. Red lines indicate the sewage network, which covers 56.9% of the city’s population. B) Frequency of detection of rat hepatitis E virus during 2023–2024, per month. The circles indicate detections per week sampled within each month.
1These authors contributed equally to this article.
Page created: December 30, 2025
Page updated: January 29, 2026
Page reviewed: January 29, 2026
The conclusions, findings, and opinions expressed by authors contributing to this journal do not necessarily reflect the official position of the U.S. Department of Health and Human Services, the Public Health Service, the Centers for Disease Control and Prevention, or the authors' affiliated institutions. Use of trade names is for identification only and does not imply endorsement by any of the groups named above.