Skip directly to site content Skip directly to page options Skip directly to A-Z link Skip directly to A-Z link Skip directly to A-Z link

Disclaimer: Early release articles are not considered as final versions. Any changes will be reflected in the online version in the month the article is officially released.

Volume 32, Supplement –Summer 2026

SUPPLEMENT ISSUE
Other

Implementation and Early Outcomes of Laboratory Proficiency Testing Program for National Wastewater Surveillance System, United States, 2024

H. Auguste DutcherComments to Author , Dagmara S. Antkiewicz, Adélaïde J. Roguet, and Martin M. Shafer
Author affiliation: Wisconsin State Laboratory of Hygiene, University of Wisconsin–Madison, Madison, Wisconsin, USA

Main Article

Figure 3

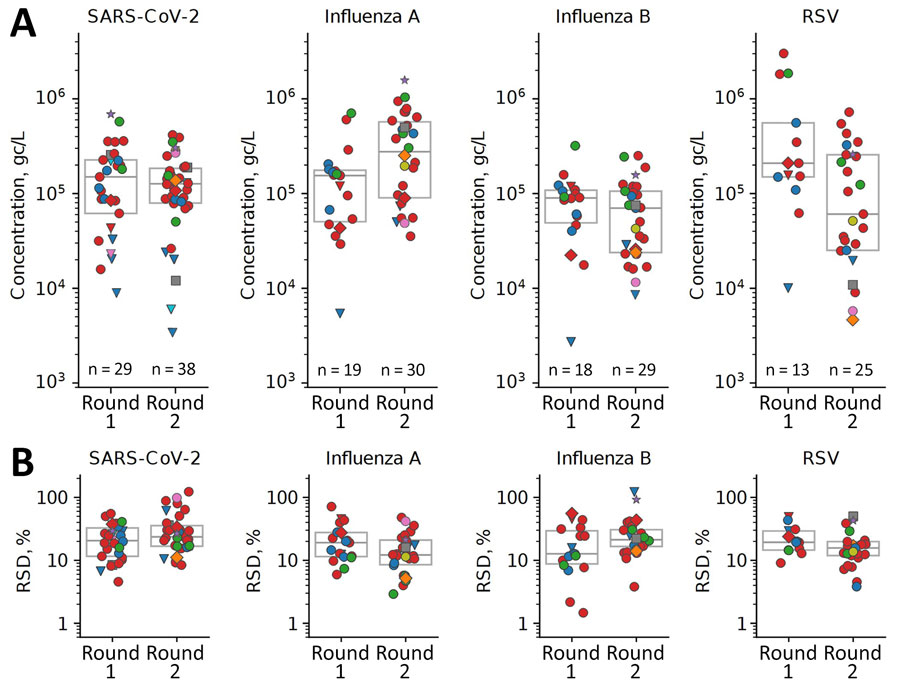
Results from first 2 rounds of Wisconsin Wastewater Monitoring Program proficiency testing, including respiratory pathogens SARS-CoV-2, influenza A, influenza B, and RSV in study of implementation and early outcomes of laboratory proficiency testing program for National Wastewater Surveillance System, United States, 2024. A) Concentrations of pathogens reported by the laboratories participating in proficiency testing rounds 1 and 2. Each symbol represents 1 laboratory’s results from a single workflow, averaged over gene targets (if applicable) and replicates (n = 3 for both rounds). B) RSD (%) of pathogen concentrations reported from the replicates in panel A (n = 3). Shapes and colors denote different methods of wastewater concentration and extraction (Figure 1). Horizontal lines within boxes indicate median, top lines of each box indicate 75th percentiles, and bottom lines represents 25th percentiles. gc/L, gene copies per liter; RSD, relative standard deviation; RSV, respiratory syncytial virus.

Figure 3. Results from first 2 rounds of Wisconsin Wastewater Monitoring Program proficiency testing, including respiratory pathogens SARS-CoV-2, influenza A, influenza B, and RSV in study of implementation and early outcomes of laboratory proficiency testing program for National Wastewater Surveillance System, United States, 2024. A) Concentrations of pathogens reported by the laboratories participating in proficiency testing rounds 1 and 2. Each symbol represents 1 laboratory’s results from a single workflow, averaged over gene targets (if applicable) and replicates (n = 3 for both rounds). B) RSD (%) of pathogen concentrations reported from the replicates in panel A (n = 3). Shapes and colors denote different methods of wastewater concentration and extraction (Figure 1). Horizontal lines within boxes indicate median, top lines of each box indicate 75th percentiles, and bottom lines represents 25th percentiles. gc/L, gene copies per liter; RSD, relative standard deviation; RSV, respiratory syncytial virus.

Main Article

Page created: May 21, 2026
Page updated: August 10, 2026
Page reviewed: August 10, 2026
The conclusions, findings, and opinions expressed by authors contributing to this journal do not necessarily reflect the official position of the U.S. Department of Health and Human Services, the Public Health Service, the Centers for Disease Control and Prevention, or the authors' affiliated institutions. Use of trade names is for identification only and does not imply endorsement by any of the groups named above.
file_external