Volume 32, Supplement –Summer 2026
SUPPLEMENT ISSUE
Supplement
Implementation and Early Outcomes of Laboratory Proficiency Testing Program for the National Wastewater Surveillance System, United States, 2024

 , Dagmara S. Antkiewicz, Adélaïde J. Roguet, and Martin M. Shafer
Cite This Article
Citation for Media
Abstract
Underlying the core goals of the Centers for Disease Control and Prevention National Wastewater Surveillance System (NWSS) in the United States is the need for robust and reliable pathogen data. The rapid build-out of the NWSS network and participation of many laboratories with varying expertise in environmental molecular methods has resulted in a lack of method standardization and poor data comparability. Proficiency testing is a powerful strategy to address this challenge. We describe preliminary outcomes from 2 proficiency testing rounds with 38 total participating laboratories, where reported respiratory virus concentrations from replicate samples spanned roughly 2 orders of magnitude; the program identified key opportunities for improvement. Although still in its infancy, this program proved an effective tool for quantifying variability across the network, offering preliminary insights on method performance, and improving data quality through laboratory support. Our results suggest that wastewater proficiency testing for disease surveillance will improve data quality and strengthen the NWSS.
Wastewater-based surveillance (WBS) for pathogens is increasingly recognized as a valuable complement to traditional clinical monitoring, serving as a leading indicator of increased disease transmission and providing less biased, cost-efficient community monitoring (1,2). Through the Centers for Disease Control and Prevention (CDC) National Wastewater Surveillance System (NWSS), the United States has established a network of laboratories reporting pathogen concentrations in wastewater, supporting public health decision-making (3,4). However, the rapid expansion of the network has outpaced the development of standardized protocols, resulting in substantial methodologic heterogeneity across laboratories (3,5).
With limited tools to assess the existing diverse methods used by laboratories with varied WBS experience, the comparability and utility of the data submitted to the NWSS program are compromised. Many potential sources of data variability in WBS are known, but only a handful of studies have systematically investigated their relative influence on pathogen recoveries (2,6–9). To date, very few interlaboratory comparisons have been conducted (10,11). Furthermore, many laboratories have insufficient resources for method optimization and operate with limited expertise and support.
A recent report from the National Academies of Sciences, Engineering, and Medicine emphasized the importance of cross-network data standardization for endurance of the network and pointed to proficiency testing (PT) as an avenue to improve data comparability (12). PT programs are a well-established mechanism in clinical and environmental testing for benchmarking performance (13–16), yet to our knowledge no such program exists for pathogens in wastewater, except for the Canada-focused program operated by the Ontario Clean Water Agency (17). Moreover, PT programs can provide insights on inter- and intra-laboratory variability, identify low- and high-performing protocols, and guide the establishment of networkwide uncertainty metrics to aid in data interpretation (5).
We describe preliminary outcomes of the first 2 rounds of a PT program designed and implemented by the Wisconsin Wastewater Monitoring Program (WWMP), a Center of Excellence in wastewater surveillance (WS) supported by the Centers for Disease Control and Prevention. We report on variability in pathogen quantification, methodologic diversity, and the effect of PT participation on laboratory performance. We identify key factors that contribute to interlaboratory variability, paving the way for future recommendations that could improve cross-network comparability. Finally, we discuss the implications of our findings for future rounds of our PT program as part of a broader effort to strengthen nationwide WS.
We spiked influent from the same water reclamation facility with inactivated influenza A/B and respiratory syncytial virus and inactivated SARS-CoV-2 B.1.1.7 whole virus (Microbiologics, https://www.microbiologics.com) at levels above the detection limit (Appendix). We added spikes per tube to preserve material (round 1) or to a bulk sample prior to aliquoting (round 2). We evaluated wastewater samples for select physiochemical characteristics, which were consistent with historical norms. We prepared 3 replicate samples per participant by using a polypropylene churn splitter (SP Bel-Art, https://www.belart.com) and shipped all samples chilled for next-day delivery. We verified replicate consistency (sample homogeneity) with the start-to-finish turbidity (Appendix Table 2) and digital PCR analysis. We conducted a 2-week decay study to ensure stability of the viral signal over the assigned sample analysis window. Viral concentrations decreased an average of 30% at 1 week from preparation for influenza and SARS-CoV-2 (Appendix Table 1).
The WWMP PT program maintained some elements of traditional PT while incorporating features designed to support laboratories and improve data comparability across the NWSS network. Participating laboratories received wastewater samples, and we instructed them to perform their standard wastewater pathogen protocols (consistent with NWSS, which imposes no prescribed workflow). Alongside quantification results, laboratories submitted detailed metadata of their wastewater processing workflows (https://doi.org/10.6084/m9.figshare.32301843). We used those metadata for quality assurance and to better understand the methodologic factors that can influence performance.
Metadata Overview and Influence of Sample Pretreatment on Data Interpretation
Figure 1
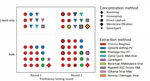
Figure 1. Laboratory workflows represented by the participants of the first 2 rounds of the Wisconsin Wastewater Monitoring Program wastewater proficiency testing program in study of implementation and early outcomes of laboratory...
We conducted the first 2 rounds of our WS PT program in 2024 and focused on the respiratory pathogens SARS-CoV-2, influenza A virus, influenza B virus, and respiratory syncytial virus, along with any fecal markers and process recovery controls assessed by participating laboratories. Across both rounds (involving 38 unique laboratories total), 27 participants were state public health laboratories, representing most of the state jurisdictions reporting to NWSS. Enrolled laboratories used a wide variety of concentration and extraction methods (Figure 1; Appendix Tables 4–6).
To assess the effects of viral partitioning between the liquid phase and particulate matter on method performance, we asked laboratories to specify the wastewater phase processed in their workflows. Most laboratories analyzed a bulk sample (18 laboratories in round 1 and 24 in round 2), defined as a sample with no solids removal. Laboratories processing liquid-only samples (11 laboratories in round 1 and 14 in round 2) used a solids removal method such as centrifugation or filtration. Prior work has shown that SARS-CoV-2 and other viruses can associate strongly with solids and that sample prefractionation can substantially influence measured concentrations (18,19). NWSS uses a purely relative measure to interpret and visualize wastewater data, which does not account for this bulk versus liquid only distinction; however, the magnitude of partitioning between liquid and solid fractions can vary by pathogen and may result in systematically different pathogen recoveries. To investigate this question, we selected results from the most prevalent concentration method (Ceres Nanotrap, https://www.ceresnano.com) and compared data from laboratories that analyzed bulk and liquid fractions. We observed no statistically significant difference in SARS-CoV-2 concentration distributions between the 2 fractions (Appendix Figure 2), although substantial variability across laboratories limits our ability to statistically resolve particle-partitioning effects. In addition, our PT metadata review revealed that some laboratories also pretreat samples with proteases, detergents, or both to help mobilize viral particles into the liquid phase, introducing additional complexity into the interpretation of liquid only versus bulk categories. Because our current definitions of liquid-only versus bulk might not accurately reflect true viral partitioning behavior, we opted to pool results across sample fractions for the purposes of this analysis.
Value of Follow-up and Summary Report for Participants
Figure 2
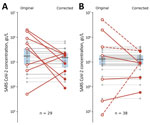
Figure 2. Reported SARS-CoV-2 concentrations in wastewater before and after Wisconsin Wastewater Monitoring Program proficiency testing (PT) intervention and laboratory resubmission of corrected concentrations in study of implementation and early outcomes of...
As previously mentioned, our comprehensive data review and follow-up with participating laboratories was a key component of each PT round. Many laboratories benefited from the support provided by the WWMP throughout their participation, including receiving guidance that led to reporting corrections. In round 2, for example, 25 of 36 laboratories required follow-up for calculation, metadata, or other clarifications to ensure accurate reporting (Appendix Table 3). Some important corrections included unit conversion and dilution adjustments and correction of misapplied processing factors, which resulted in substantial changes (sometimes by orders of magnitude) to final pathogen concentrations (Figure 2). In the second round of PT, 3 of 9 new participants required corrections to their pathogen concentration calculations, compared with just 5 of 27 returning participants, highlighting the value of continued engagement.
After data analysis by the WWMP, we sent participating laboratories a report representing compiled data (Appendix Figure 8), including summary statistics for each pathogen and an associated z-score for each laboratory. That report enabled participants to independently assess their performance compared with all laboratories and those laboratories with similar workflows. Several survey respondents highlighted these benefits; one respondent noted, “It was very useful seeing our results plotted out with other labs to see how our results compare,” and another wrote, “Having this resource provides us with a clear way to verify that our processing methods are robust.” Overall, survey responses indicated that follow-up interactions and PT reports were valuable for participants and useful for cross-laboratory performance comparisons.
Interlaboratory and Intralaboratory Variability
Figure 3
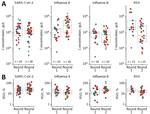
Figure 3. Results from first 2 rounds of Wisconsin Wastewater Monitoring Program proficiency testing, including respiratory pathogens SARS-CoV-2, influenza A, influenza B, and RSV in study of implementation and early outcomes of...
Compiled results showed that measured concentrations for each pathogen, which do not incorporate any recovery corrections (Appendix Figure 6), spanned approximately 2 orders of magnitude in each PT round (Figure 3, panel A), a modest improvement over the wide range reported by an interlaboratory comparison conducted in 2020 (11). The range observed in our exercises was comparable to 2 other interlaboratory comparison studies conducted with smaller laboratory cohorts (17,20). Normalization of pathogen concentrations by the fecal marker pepper mild mottle virus, which is not reported by all laboratories, did not consistently reduce data spread across pathogens (Appendix Figure 1, 3), and variances were not significantly different before versus after normalization, with the exception of SARS-CoV-2 in round 2 (p = 0.04 by Brown–Forsythe test). Restricting pathogen concentration comparisons to laboratories by using the most common workflow (bulk wastewater samples processed by using Ceres Nanotrap concentration and MagMAX extraction [Thermo Fisher Scientific, https://www.thermofisher.com]) modestly improved the comparability of reported results (range of 1.4 log10 units for SARS-CoV-2 in round 1, compared with nearly 2 log10 units for all laboratories [Appendix Figure 4]). However, sample size is limited given the overall diversity of methods used (Figure 1). Recruiting laboratories that all employ the same concentration and extraction method would enable a more rigorous assessment of cross-laboratory variability and could be a valuable design for future PT rounds.
To complement this cross-laboratory analysis, we also examined intralaboratory variation by using the 3 replicate samples included in both rounds of PT (Figure 3, panel B). Across both rounds and all pathogens, the interquartile range of relative SD across replicates was 12%–30%, and roughly 80% of all pathogen results had a relative SD <35%. Although no universally accepted benchmarks for intralaboratory variability exist for WBS, those values are very modest in the context of high interlaboratory variability and suggest that most laboratories can achieve a reasonably high level of reproducibility. Across rounds, SARS-CoV-2 z-scores were moderately correlated (Appendix Figure 7), particularly when laboratories that changed methods between round 1 and round 2 were omitted (adjusted r-squared = 0.669; p = 6.29 × 10⁻⁷), supporting NWSS’ use of site-relative reporting.
Points of Intervention Identified in First 2 Rounds of PT
A comparative analysis of method performance from the 2 rounds of PT results is inherently limited by the sample size, specifically by the small number of results representing any 1 workflow. Nonetheless, preliminary results suggest some methods might be underperforming; for example, laboratories using the Innovaprep Concentrating Pipette (https://www.innovaprep.com) reported significantly lower pathogen concentrations than those using Ceres Nanotrap particles (p<0.01 by 2-sided Mann–Whitney U test) (Appendix Figure 5, panel A). When we compared raw viral concentrations (PCR instrument data reported in gene copies/µL of PCR reaction), that lower performance was statistically significant for SARS-CoV-2 and influenza B virus only (Appendix Figure 5, panel B). Even so, those preliminary results suggest that identifying underperforming methods can be successful within the structure of the program and may be a valuable route to improving cross-network comparability.
We also noted that, for SARS-CoV-2 (the only pathogen quantified by all participating laboratories), the lowest quartile contributed disproportionately to overall variability. In round 1, the lowest 25% of concentrations spanned approximately 0.8 log10 units, and in round 2, nearly 1.4 log10 units. In contrast, the upper 75% of values ranged just over 1 order of magnitude in round 1 and approximately 0.7 units in round 2 (Figure 3, panel A). That finding suggests that a relatively small subset of results accounts for a substantial fraction of interlaboratory variability. Focusing improvement efforts on laboratories and methods represented in the lowest recovery quartile could prove to be an effective means of improving network data comparability, at least for some pathogens.
Qualitative Outcomes
Results from the follow-up surveys of participants highlight the PT program’s ability to identify problem areas and provide critical support to laboratories. Survey responses identified areas for program improvement and mirrored many of our existing plans for program expansion. For example, multiple laboratories suggested that a “PCR quantification only” PT round would be of interest. Narrowing PT exercises to focus on specific steps of the overall method may prove an important strategy to determine sources of variability, a strategy our program has since implemented with a digital PCR–focused round in late 2025. One respondent noted, “It is hard to compare our results to others since our protocol is not aligned with the majority. Maybe including an RNA sample for PCR only so we can determine if our PCR assay is comparable.” Another laboratory expressed interest specifically in high-consequence pathogens: “It would be interesting to investigate how different targets such as mpox and measles compare with the respiratory targets to determine if there are alternate processing methods needed to provide robust data for these targets.” Recognizing that need, our recently completed rounds of the PT program have included high-consequence pathogens that are relatively new additions to wastewater testing panels.
Of note, several laboratories reported correcting mistakes or reevaluating internal processes as a result of participation. In the follow-up survey, 4 respondents in round 1 and 5 respondents in round 2 indicated that their laboratories had corrected a mistake in calculations or their reported results (13 survey responses per round). One participant noted in their follow-up survey, “We found many problems with our method which without the PT report we would not have found.” Another laboratory reported changing methods to improve pathogen recovery after seeing their laboratory’s relative performance. Survey responses confirmed that enrolled laboratories welcome ongoing guidance; one respondent noted, “I’m looking forward to continued guidance on method optimization.” Together, those findings confirm that the program not only provides a comparative assessment of method performance but also is a powerful approach to improve data quality and laboratory practices.
Early results from WWMP’s wastewater PT program demonstrated the value of structured interlaboratory comparisons in improving overall network data quality. Our findings corroborate previously reported variability in cross-laboratory pathogen quantification from wastewater and highlight the critical role of PT in identifying areas of improvement. From the first 2 rounds alone, we lack sufficient data to confidently reject any specific methods; instead, a key outcome of the initial rounds was identifying reporting errors, often stemming from calculation mistakes or unfamiliarity with standard practices. Incorporating individual consultations and collecting raw data (including metadata) as part of our program design proved essential for improving data quality. For multiple laboratories, the exercise provided an avenue for scientific guidance for their programs, and the act of participating alone improved data quality, suggesting that all laboratories reporting to NWSS would benefit from participating in PT.
Looking ahead, the goals for our wastewater PT program include expanding participation, incorporating additional pathogens, and improving various aspects of program implementation, such as metadata capture and reporting. Progress on those goals has already been made, including implementation of cloud-based data capture in round 3 and a measles-focused PCR quantification–only round 4. Contingent on continued financial support, we aim to continue our program implementation into the foreseeable future, with a long-term goal to make more specific recommendations regarding laboratory methodology and performance. Those efforts will improve the quality and comparability of WS data, strengthening NWSS and ensuring that the underlying data are as robust and reliable as possible for unbiased and defensible public health decision-making.
Dr. Dutcher is a scientist at the Wisconsin State Laboratory of Hygiene at the University of Wisconsin, Madison. Together with her colleagues in the Wisconsin Wastewater Monitoring Program, she leads efforts on proficiency testing, multidrug-resistant organism detection, and pathogen sequencing from wastewater.
Acknowledgments
We thank the Wisconsin State Laboratory of Hygiene Proficiency Testing Department for coordinating PT program enrollment and shipping of wastewater samples. We also thank the Wisconsin State Laboratory of Hygiene Wastewater Surveillance Team for support in project implementation. The insightful discussions with Alex Chik on PT program implementations are much appreciated. Many thanks to the Madison Metropolitan Sewerage District for ongoing support of our method development efforts.
This work was supported by the Wisconsin Department of Health Services (DHS) using funds provided by the Centers for Disease Control and Prevention through the Epidemiology and Laboratory Capacity program, including National Wastewater Surveillance System 2 (DHS grant agreement no. 435100-A25-ELCProj-00-M1) and the Epidemiology and Laboratory Capacity program’s Enhancing Detection Expansion program (DHS grant agreement nos. 435100-A24-ELCProj-01 and 435100-A25-ELCProj-00).
We acknowledge the use of Microsoft Copilot (GPT-4, OpenAI) for assistance with phrasing and clarity during manuscript preparation.
References
- Carmo Dos Santos M, Cerqueira Silva AC, Dos Reis Teixeira C, Pinheiro Macedo Prazeres F, Fernandes Dos Santos R, de Araújo Rolo C, et al. Wastewater surveillance for viral pathogens: a tool for public health. Heliyon. 2024;10:
e33873 . DOIPubMedGoogle Scholar - LaTurner ZW, Zong DM, Kalvapalle P, Gamas KR, Terwilliger A, Crosby T, et al. Evaluating recovery, cost, and throughput of different concentration methods for SARS-CoV-2 wastewater-based epidemiology. Water Res. 2021;197:
117043 . DOIPubMedGoogle Scholar - Adams C, Bias M, Welsh RM, Webb J, Reese H, Delgado S, et al. The National Wastewater Surveillance System (NWSS): from inception to widespread coverage, 2020–2022, United States. Sci Total Environ. 2024;924:
171566 . DOIPubMedGoogle Scholar - Valencia D, Yu AT, Wheeler A, Hopkins L, Pray I, Horter L, et al. Notes from the field: the National Wastewater Surveillance System’s Centers of Excellence contributions to public health action during the respiratory virus season—four U.S. jurisdictions, 2022–23. MMWR Morb Mortal Wkly Rep. 2023;72:1309–12. DOIPubMedGoogle Scholar
- Keenum I, Lin NJ, Logan-Jackson A, Gushgari AJ, D’Souza N, Steele JA, et al. Optimizing wastewater surveillance: the necessity of standardized reporting and proficiency for public health. Am J Public Health. 2024;114:859–63. DOIPubMedGoogle Scholar
- Antkiewicz DS, Janssen KH, Roguet A, Pilch HE, Fahney RB, Mullen PA, et al. Wastewater-based protocols for SARS-CoV-2: insights into virus concentration, extraction, and quantitation methods from two years of public health surveillance. Environ Sci Water Res Technol. 2024;10:1766–84. DOIGoogle Scholar
- Azzellino A, Pellegrinelli L, Pedrini R, Turolla A, Bertasi B, Binda S, et al. Evaluating interlaboratory variability in wastewater-based COVID-19 surveillance. Microorganisms. 2025;13:526. DOIPubMedGoogle Scholar
- Babler KM, Amirali A, Sharkey ME, Williams SL, Boone MM, Cosculluela GA, et al. Comparison of electronegative filtration to magnetic bead-based concentration and V2G-qPCR to RT-qPCR for quantifying viral SARS-CoV-2 RNA from wastewater. ACS ES T Water. 2022;2:2004–13. DOIPubMedGoogle Scholar
- Kaya D, Niemeier D, Ahmed W, Kjellerup BV. Evaluation of multiple analytical methods for SARS-CoV-2 surveillance in wastewater samples. Sci Total Environ. 2022;808:
152033 . DOIPubMedGoogle Scholar - Chik AHS, Ho JJY, Srikanthan N, Dhiyebi H, Servos M. Design and validation of sample splitting protocol for comparison of SARS-CoV-2 quantification in wastewater. J Environ Eng. 2022;148:
06022001 . DOIGoogle Scholar - Pecson BM, Darby E, Haas CN, Amha YM, Bartolo M, Danielson R, et al.; SARS-CoV-2 Interlaboratory Consortium. Reproducibility and sensitivity of 36 methods to quantify the SARS-CoV-2 genetic signal in raw wastewater: findings from an interlaboratory methods evaluation in the U.S. Environ Sci Water Res Technol. 2021;7:504–20. DOIPubMedGoogle Scholar
- Committee on Community Wastewater-based Infectious Disease Surveillance, Water Science and Technology Board, Division on Earth and Life Studies, Board on Population Health and Public Health Practice, Health and Medicine Division, National Academies of Sciences, Engineering, and Medicine. Increasing the utility of wastewater-based disease surveillance for public health action: a phase 2 report. Washington: The National Academies Press; 2024 [cited 2025 Aug 1]. DOIGoogle Scholar
- Stang HL, Anderson NL. Use of proficiency testing as a tool to improve quality in microbiology laboratories. Clin Microbiol Newsl. 2013;35:145–52. DOIPubMedGoogle Scholar
- Rosengren A, Heneryd AC. Proficiency testing schemes—their role in quality assurance. Int J Food Microbiol. 1998;45:55. DOIPubMedGoogle Scholar
- Babady NE, Bourassa L, Burnham CD, Fisher M, McElvania E, Polage CR, et al. Multicenter evaluation of processing and analysis of College of American Pathologists (CAP) proficiency testing samples by laboratory automation. J Clin Microbiol. 2021;59:e03233–20. DOIPubMedGoogle Scholar
- Van Vliet KE, Muir P, Echevarria JM, Klapper PE, Cleator GM, Van Loon AM. Multicenter proficiency testing of nucleic acid amplification methods for the detection of enteroviruses. J Clin Microbiol. 2001;39:3390–2. DOIPubMedGoogle Scholar
- Chik AHS, Glier MB, Servos M, Mangat CS, Pang XL, Qiu Y, et al.; Canadian SARS-CoV-2 Inter-Laboratory Consortium. Comparison of approaches to quantify SARS-CoV-2 in wastewater using RT-qPCR: results and implications from a collaborative inter-laboratory study in Canada. J Environ Sci (China). 2021;107:218–29. DOIPubMedGoogle Scholar
- Roldan-Hernandez L, Boehm AB. Adsorption of respiratory syncytial virus, rhinovirus, SARS-CoV-2, and F+ bacteriophage MS2 RNA onto wastewater solids from raw wastewater. Environ Sci Technol. 2023;57:13346–55. DOIPubMedGoogle Scholar
- Phaneuf JR, Cha G, Hatt JK, Konstantinidis KT, Graham KE. Decay and solid-liquid partitioning of mpox and vaccinia virus DNA in primary influent and settled solids to guide wastewater-based epidemiology practices. Water Res. 2025;284:
123904 . DOIPubMedGoogle Scholar - Davis A, Keely SP, Brinkman NE, Bohrer Z, Ai Y, Mou X, et al. Evaluation of intra- and inter-lab variability in quantifying SARS-CoV-2 in a state-wide wastewater monitoring network. Environ Sci Water Res Technol. 2023;9:1053–68. DOIPubMedGoogle Scholar
Figures
Cite This ArticleOriginal Publication Date: August 10, 2026
Table of Contents – Volume 32, Supplement—August 2026
| EID Search Options |
|---|
 Advanced Article Search – Search articles by author and/or keyword.
|
 Articles by Country Search – Search articles by the topic country.
|
 Article Type Search – Search articles by article type and issue.
|
Please use the form below to submit correspondence to the authors or contact them at the following address:
H. Auguste Dutcher, Wisconsin State Laboratory of Hygiene, 2601 Agriculture Dr, Madison, WI 53718, USA
Top