Volume 32, Supplement –Summer 2026
SUPPLEMENT ISSUE
Supplement
Early-Season Detection of Influenza A(H3N2) Subclade K in Wastewater, Colorado, USA, 2025–2026

Figure 2
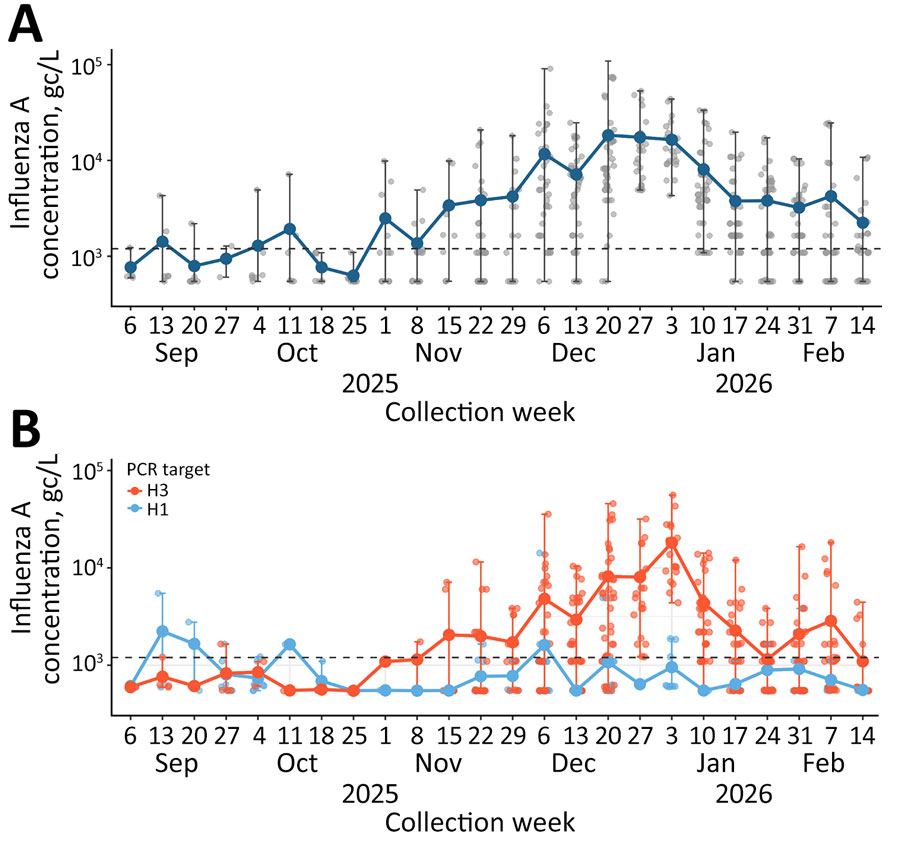
Figure 2. Influenza A viral concentration in wastewater in study of early-season detection of influenza A(H3N2) subclade K, Colorado, USA, 2025–2026. A) Influenza A target concentration. Blue points and connecting lines show the average concentration and trend by week. Gray points show concentrations for each sample collected by week. Error bars show the range of concentration by week. Dashed horizontal line indicates the defined limit of quantification, 1,200 gc/L. No sites had influenza A detection for the weeks ending October 18 and 25, 2025. B) Influenza H1 and H3 concentration in wastewater. Points and connecting lines show the average concentration and trend by week. Error bars show the range of concentration by week. Dashed horizontal line indicates the defined limit of quantification, 1,200 gc/L. No sites had H3 detections for the weeks ending October 4, 11, 18, and 25 and November 1, 2025. There were no H1 detections for the weeks ending October 18 and 25 and November 1, 8, and 15, 2025, or for January 10 and 17 and February 7 and 14, 2026. Concentration is shown in log10 scale. Collection week is shown by the week ending date. gc, gene copies.