Skip directly to site content Skip directly to page options Skip directly to A-Z link Skip directly to A-Z link Skip directly to A-Z link

Disclaimer: Early release articles are not considered as final versions. Any changes will be reflected in the online version in the month the article is officially released.

Volume 32, Supplement –Summer 2026

SUPPLEMENT ISSUE
Supplement

Early-Season Detection of Influenza A(H3N2) Subclade K in Wastewater, Colorado, USA, 2025–2026

Molly C. Hetherington-Rauth, Van Nguyen, Emily Washeleski, Kevin Castro Vital, Gabrielle Lequia, Deborah Aragon, Nisha B. Alden, Kirsten Weisbeck, Laura Bankers, Alexandria Rossheim, Allison Wheeler, and Shannon R. MatzingerComments to Author 
Author affiliation: Colorado Department of Public Health and Environment, Denver, Colorado, USA

Main Article

Figure 3

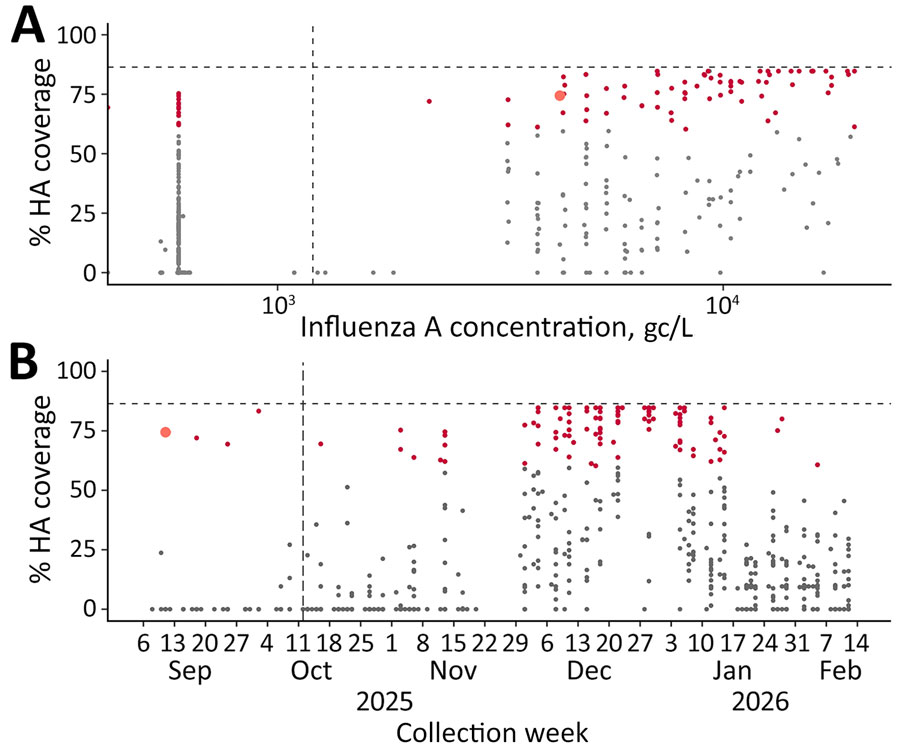
Wastewater sequencing metrics in study of early-season detection of influenza A(H3N2) subclade K in wastewater, Colorado, USA, 2025–2026. A) Percentage coverage of HA gene plotted against influenza A viral concentration. Orange represents sample with the first subclade K detection, collected October 16, 2025. Red represents samples with >60% coverage required for performing deconvolution. Gray represents samples with <60% coverage. Horizontal dashed line indicates the tiled amplicon scheme, which covers 86.7% of the HA gene reference sequence. Vertical dashed line indicates the defined limit of quantification, 1,200 gc/L. B) Percentage coverage of HA gene plotted against sample collection date. Horizontal dashed line indicates the tiled amplicon scheme, which covers 86.7% of the HA gene reference sequence. Vertical dashed line indicates the collection date of the first clinical sample characterized as subclade K, October 23, 2025. gc, gene copies; HA, hemagglutinin.

Figure 3. Wastewater sequencing metrics in study of early-season detection of influenza A(H3N2) subclade K in wastewater, Colorado, USA, 2025–2026. A) Percentage coverage of HA gene plotted against influenza A viral concentration. Orange represents sample with the first subclade K detection, collected October 16, 2025. Red represents samples with >60% coverage required for performing deconvolution. Gray represents samples with <60% coverage. Horizontal dashed line indicates the tiled amplicon scheme, which covers 86.7% of the HA gene reference sequence. Vertical dashed line indicates the defined limit of quantification, 1,200 gc/L. B) Percentage coverage of HA gene plotted against sample collection date. Horizontal dashed line indicates the tiled amplicon scheme, which covers 86.7% of the HA gene reference sequence. Vertical dashed line indicates the collection date of the first clinical sample characterized as subclade K, October 23, 2025. gc, gene copies; HA, hemagglutinin.

Main Article

Page created: June 29, 2026
Page updated: August 06, 2026
Page reviewed: August 06, 2026
The conclusions, findings, and opinions expressed by authors contributing to this journal do not necessarily reflect the official position of the U.S. Department of Health and Human Services, the Public Health Service, the Centers for Disease Control and Prevention, or the authors' affiliated institutions. Use of trade names is for identification only and does not imply endorsement by any of the groups named above.
file_external