Skip directly to site content Skip directly to page options Skip directly to A-Z link Skip directly to A-Z link Skip directly to A-Z link

Disclaimer: Early release articles are not considered as final versions. Any changes will be reflected in the online version in the month the article is officially released.

Volume 32, Number 2—February 2026

Research

Predictors of Fatal Outcomes among Pediatric Patients Hospitalized for Rocky Mountain Spotted Fever, Sonora, Mexico, 2004–20241

Stephanie Bellman, Kaci D. McCoy, Diana Enriquez, Pamela Romo, JongIn Hwang, Kathleen Weimer, Sarah M. Gunter, José Luis Alomía-Zegarra, Kristy O. Murray2Comments to Author , and Gerardo Álvarez-Hernández2
Author affiliation: Emory University School of Medicine, Atlanta, Georgia, USA (S. Bellman, K.D. McCoy, J. Hwang, K. Weimer, K.O. Murray); Children’s Healthcare of Atlanta, Atlanta (S. Bellman, K.D. McCoy, J. Hwang, K. Weimer, K.O. Murray); University of Sonora, Hermosillo, Mexico (D. Enriquez, P. Romo, G. Álvarez-Hernández); Baylor College of Medicine and Texas Children’s Hospital, Houston, Texas, USA (S.M. Gunter); Secretaría de Salud Pública del Estado de Sonora, Hermosillo (J.L. Alomía-Zegarra); Hospital Infantil del Estado de Sonora, Hermosillo (G. Álvarez-Hernández)

Main Article

Figure 2

Attack rates by municipality of residence in study of predictors of fatal outcomes among pediatric patients hospitalized for Rocky Mountain spotted fever, Sonora, Mexico, 2004–2024. Map created by Esri ArcGIS Online (https://www.esri.com), June 2025. The map includes data from Esri, TomTom (https://www.tomtom.com), Garmin (https://www.garmin.com), Food and Agriculture Organization of the United Nations (https://www.fao.org), National Oceanic and Atmospheric Administration (https://www.noaa.gov), US Geological Survey (https://www.usgs.gov), OpenStreetMap contributors (https://www.openstreetmap.org), and the GIS User Community (https://communitymaps.arcgis.com).

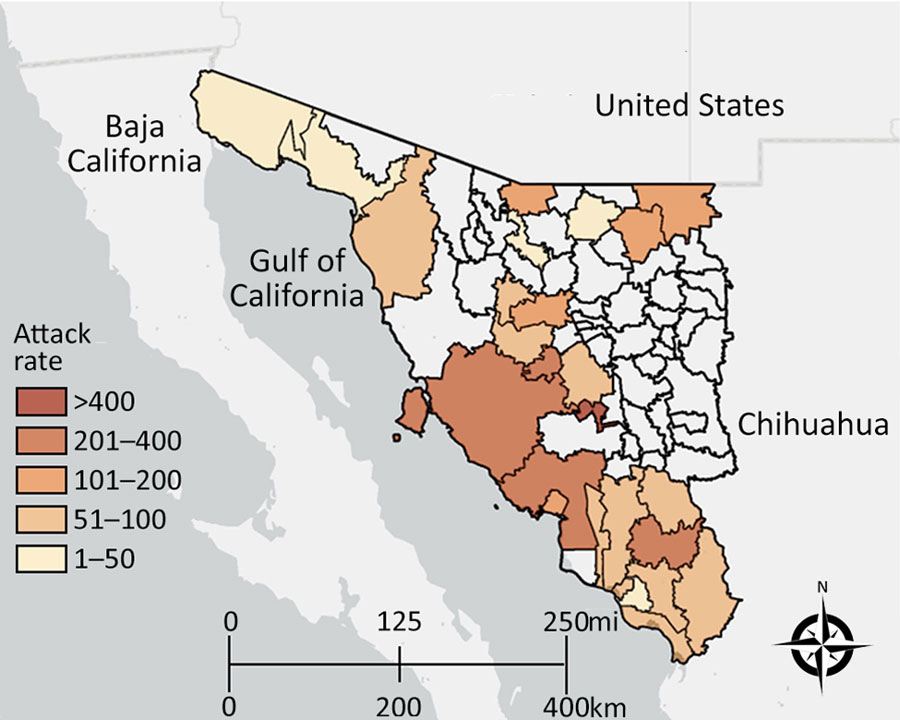
Figure 2. Attack rates by municipality of residence in study of predictors of fatal outcomes among pediatric patients hospitalized for Rocky Mountain spotted fever, Sonora, Mexico, 2004–2024. Map created by Esri ArcGIS Online (https://www.esri.com), June 2025. The map includes data from Esri, TomTom (https://www.tomtom.com), Garmin (https://www.garmin.com), Food and Agriculture Organization of the United Nations (https://www.fao.org), National Oceanic and Atmospheric Administration (https://www.noaa.gov), US Geological Survey (https://www.usgs.gov), OpenStreetMap contributors (https://www.openstreetmap.org), and the GIS User Community (https://communitymaps.arcgis.com).

Main Article

1Preliminary results from this study were presented at the Southeastern Pediatric Research Conference; June 6, 2025; Atlanta, Georgia, USA; and at the American Society of Tropical Medicine and Hygiene Conference; November 10, 2025; Toronto, Ontario, Canada.

2These senior authors contributed equally to this article.

Page created: January 20, 2026
Page updated: February 05, 2026
Page reviewed: February 05, 2026
The conclusions, findings, and opinions expressed by authors contributing to this journal do not necessarily reflect the official position of the U.S. Department of Health and Human Services, the Public Health Service, the Centers for Disease Control and Prevention, or the authors' affiliated institutions. Use of trade names is for identification only and does not imply endorsement by any of the groups named above.
file_external