Volume 32, Number 3—March 2026
Dispatch
Home-Based Monitoring of Treatment-Related Adverse Events during Drug-Resistant Tuberculosis Treatment, India, 2020–2024
Minal Ahson, Daksha Shah, Sampada Bhide, Rajesh Deshmukh, Jonathan P. Smith, Smita Waghmare, Satish Kaipilyawar, Varsha Puri, Dilip K. Khetade, Vijay Yeldandi, Anand Date, Patrick K. Moonan1, and Christine S. Ho1
Figure
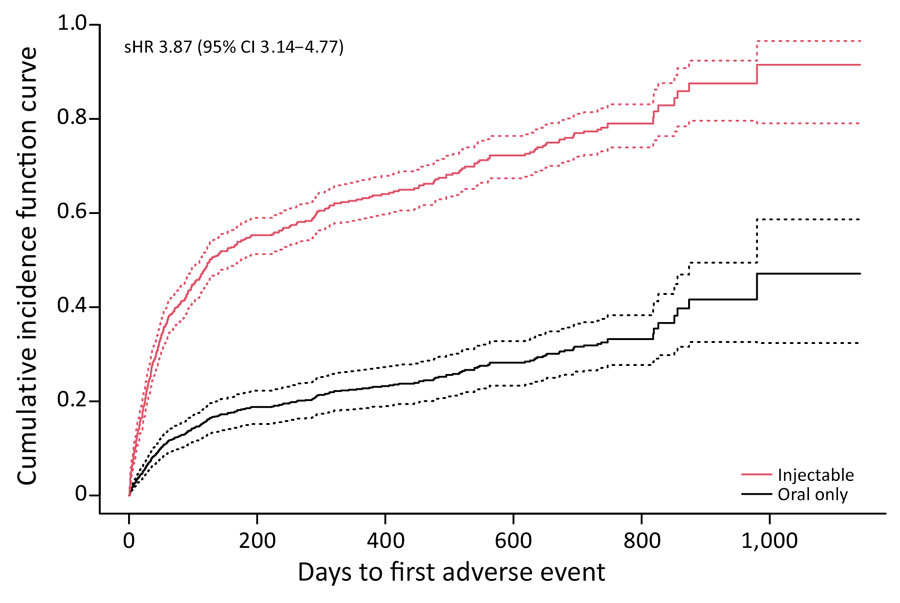
Figure. Cumulative incidence function curves of time to first clinical adverse events in a study of home-based monitoring of treatment-related adverse events during drug-resistant tuberculosis treatment, Dharavi, Mumbai, India, 2020‒2024. Graphs compare reactions between patients with injectable versus noninjectable treatment regimens among patients with drug-resistant TB. Solid lines indicate medians; dotted lines indicate 95% CIs. sHR, subdistribution hazard ratio.
1These authors contributed equally to this article.
Page created: February 20, 2026
Page updated: March 20, 2026
Page reviewed: March 20, 2026
The conclusions, findings, and opinions expressed by authors contributing to this journal do not necessarily reflect the official position of the U.S. Department of Health and Human Services, the Public Health Service, the Centers for Disease Control and Prevention, or the authors' affiliated institutions. Use of trade names is for identification only and does not imply endorsement by any of the groups named above.