Skip directly to site content Skip directly to page options Skip directly to A-Z link Skip directly to A-Z link Skip directly to A-Z link

Disclaimer: Early release articles are not considered as final versions. Any changes will be reflected in the online version in the month the article is officially released.

Volume 32, Number 5—May 2026

Dispatch

Highly Pathogenic Avian Influenza A(H5N1) Clade 2.3.4.4b Virus and Mass Mortality in Eurasian Cranes, Germany, 2025

Anne Günther, Christof Herrmann, Julia Sehl-Ewert, Simon Piro, Ann Kathrin Ahrens, Sten Calvelage, Anne Pohlmann, Martin Beer, and Timm HarderComments to Author 
Author affiliation: Friedrich-Loeffler-Institut, Greifswald–Insel Riems, Germany (A. Günther, J. Sehl-Ewert, A.K. Ahrens, S. Calvelage, A. Pohlmann, M. Beer, T. Harder); Agency for Environment, Nature Conservation, and Geology Mecklenburg-Western Pomerania, Güstrow, Germany (C. Herrmann, S. Piro)

Main Article

Figure 3

Maximum-likelihood tree based on whole-genome analyses from study of highly pathogenic avian influenza A(H5N1) clade 2.3.4.4b virus causing mass mortality in cranes, Germany, 2025. Tree at top depicts the H5N1 genotype EA-2024-DI.2.1 cluster (blue shading and text) comprising poultry (red tip) and wild bird cases (blue tip) from Germany. For comparison, recent exemplary sequences for previous dominating genotypes DI.2 and DI.1 appear (gray) above the tree. Scale bar indicates substitutions per site. In the expanded tree at bottom, gray numbers at the branches indicate bootstrap values >90%. Sequences from infected cranes (green tip) and their cluster (green shading) are highlighted. A list of virus sequences with relevant metadata is provided (Appendix 2).

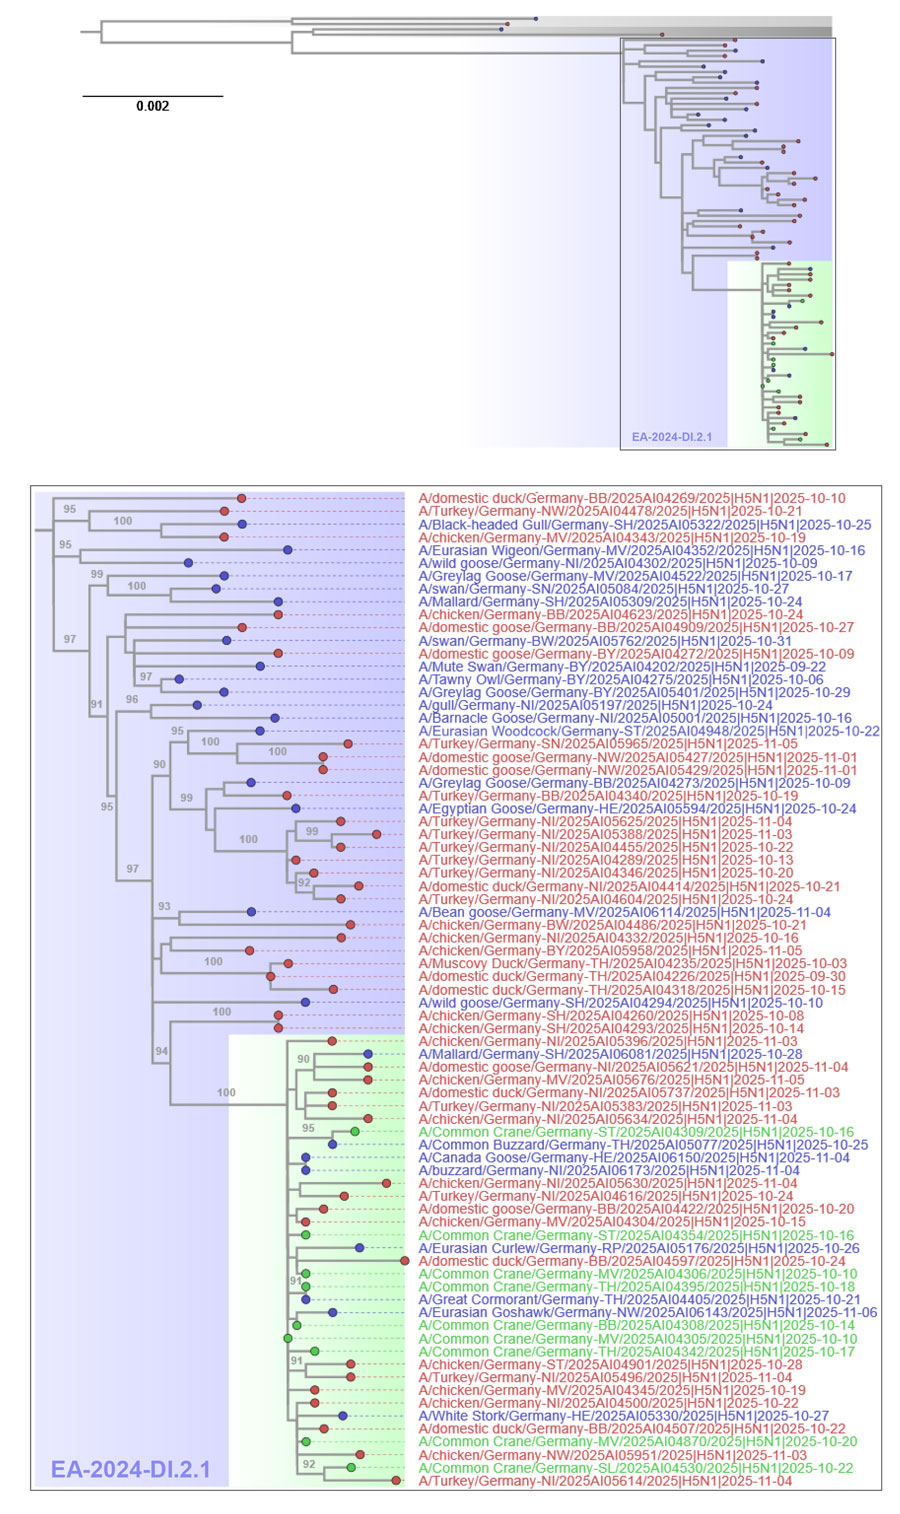
Figure 3. Maximum-likelihood tree based on whole-genome analyses from study of highly pathogenic avian influenza A(H5N1) clade 2.3.4.4b virus causing mass mortality in cranes, Germany, 2025. Tree at top depicts the H5N1 genotype EA-2024-DI.2.1 cluster (blue shading and text) comprising poultry (red tip) and wild bird cases (blue tip) from Germany. For comparison, recent exemplary sequences for previous dominating genotypes DI.2 and DI.1 appear (gray) above the tree. Scale bar indicates substitutions per site. In the expanded tree at bottom, gray numbers at the branches indicate bootstrap values >90%. Sequences from infected cranes (green tip) and their cluster (green shading) are highlighted. A list of virus sequences with relevant metadata is provided (Appendix 2).

Main Article

Page created: April 14, 2026
Page updated: April 28, 2026
Page reviewed: April 28, 2026
The conclusions, findings, and opinions expressed by authors contributing to this journal do not necessarily reflect the official position of the U.S. Department of Health and Human Services, the Public Health Service, the Centers for Disease Control and Prevention, or the authors' affiliated institutions. Use of trade names is for identification only and does not imply endorsement by any of the groups named above.
file_external