Volume 32, Number 9—September 2026
Dispatch
Genomic and Epidemiologic Insights into Ongoing Measles Outbreak, Israel, 2025–2026
Efrat Bucris1, Neta S. Zuckerman1, Tal Levin, Yara Kanaaneh, Oran Erster, Victoria Indenbaum, Keren Friedman, Danit Sofer, Eli Schwartz, Elena Chernin, Or Kriger, Rana Shibli, Sharon Elroi Prais, Zohar Mor, Nitza Abramson, Michal Savion, Naama Nuss, Ady Cohen Golan, Eva Avramovich, Dror Yakir, Liora Guy David, Efrat Rorman, Yaniv Lustig , and National Measles Working Group,2
, and National Measles Working Group,2
Figure 2
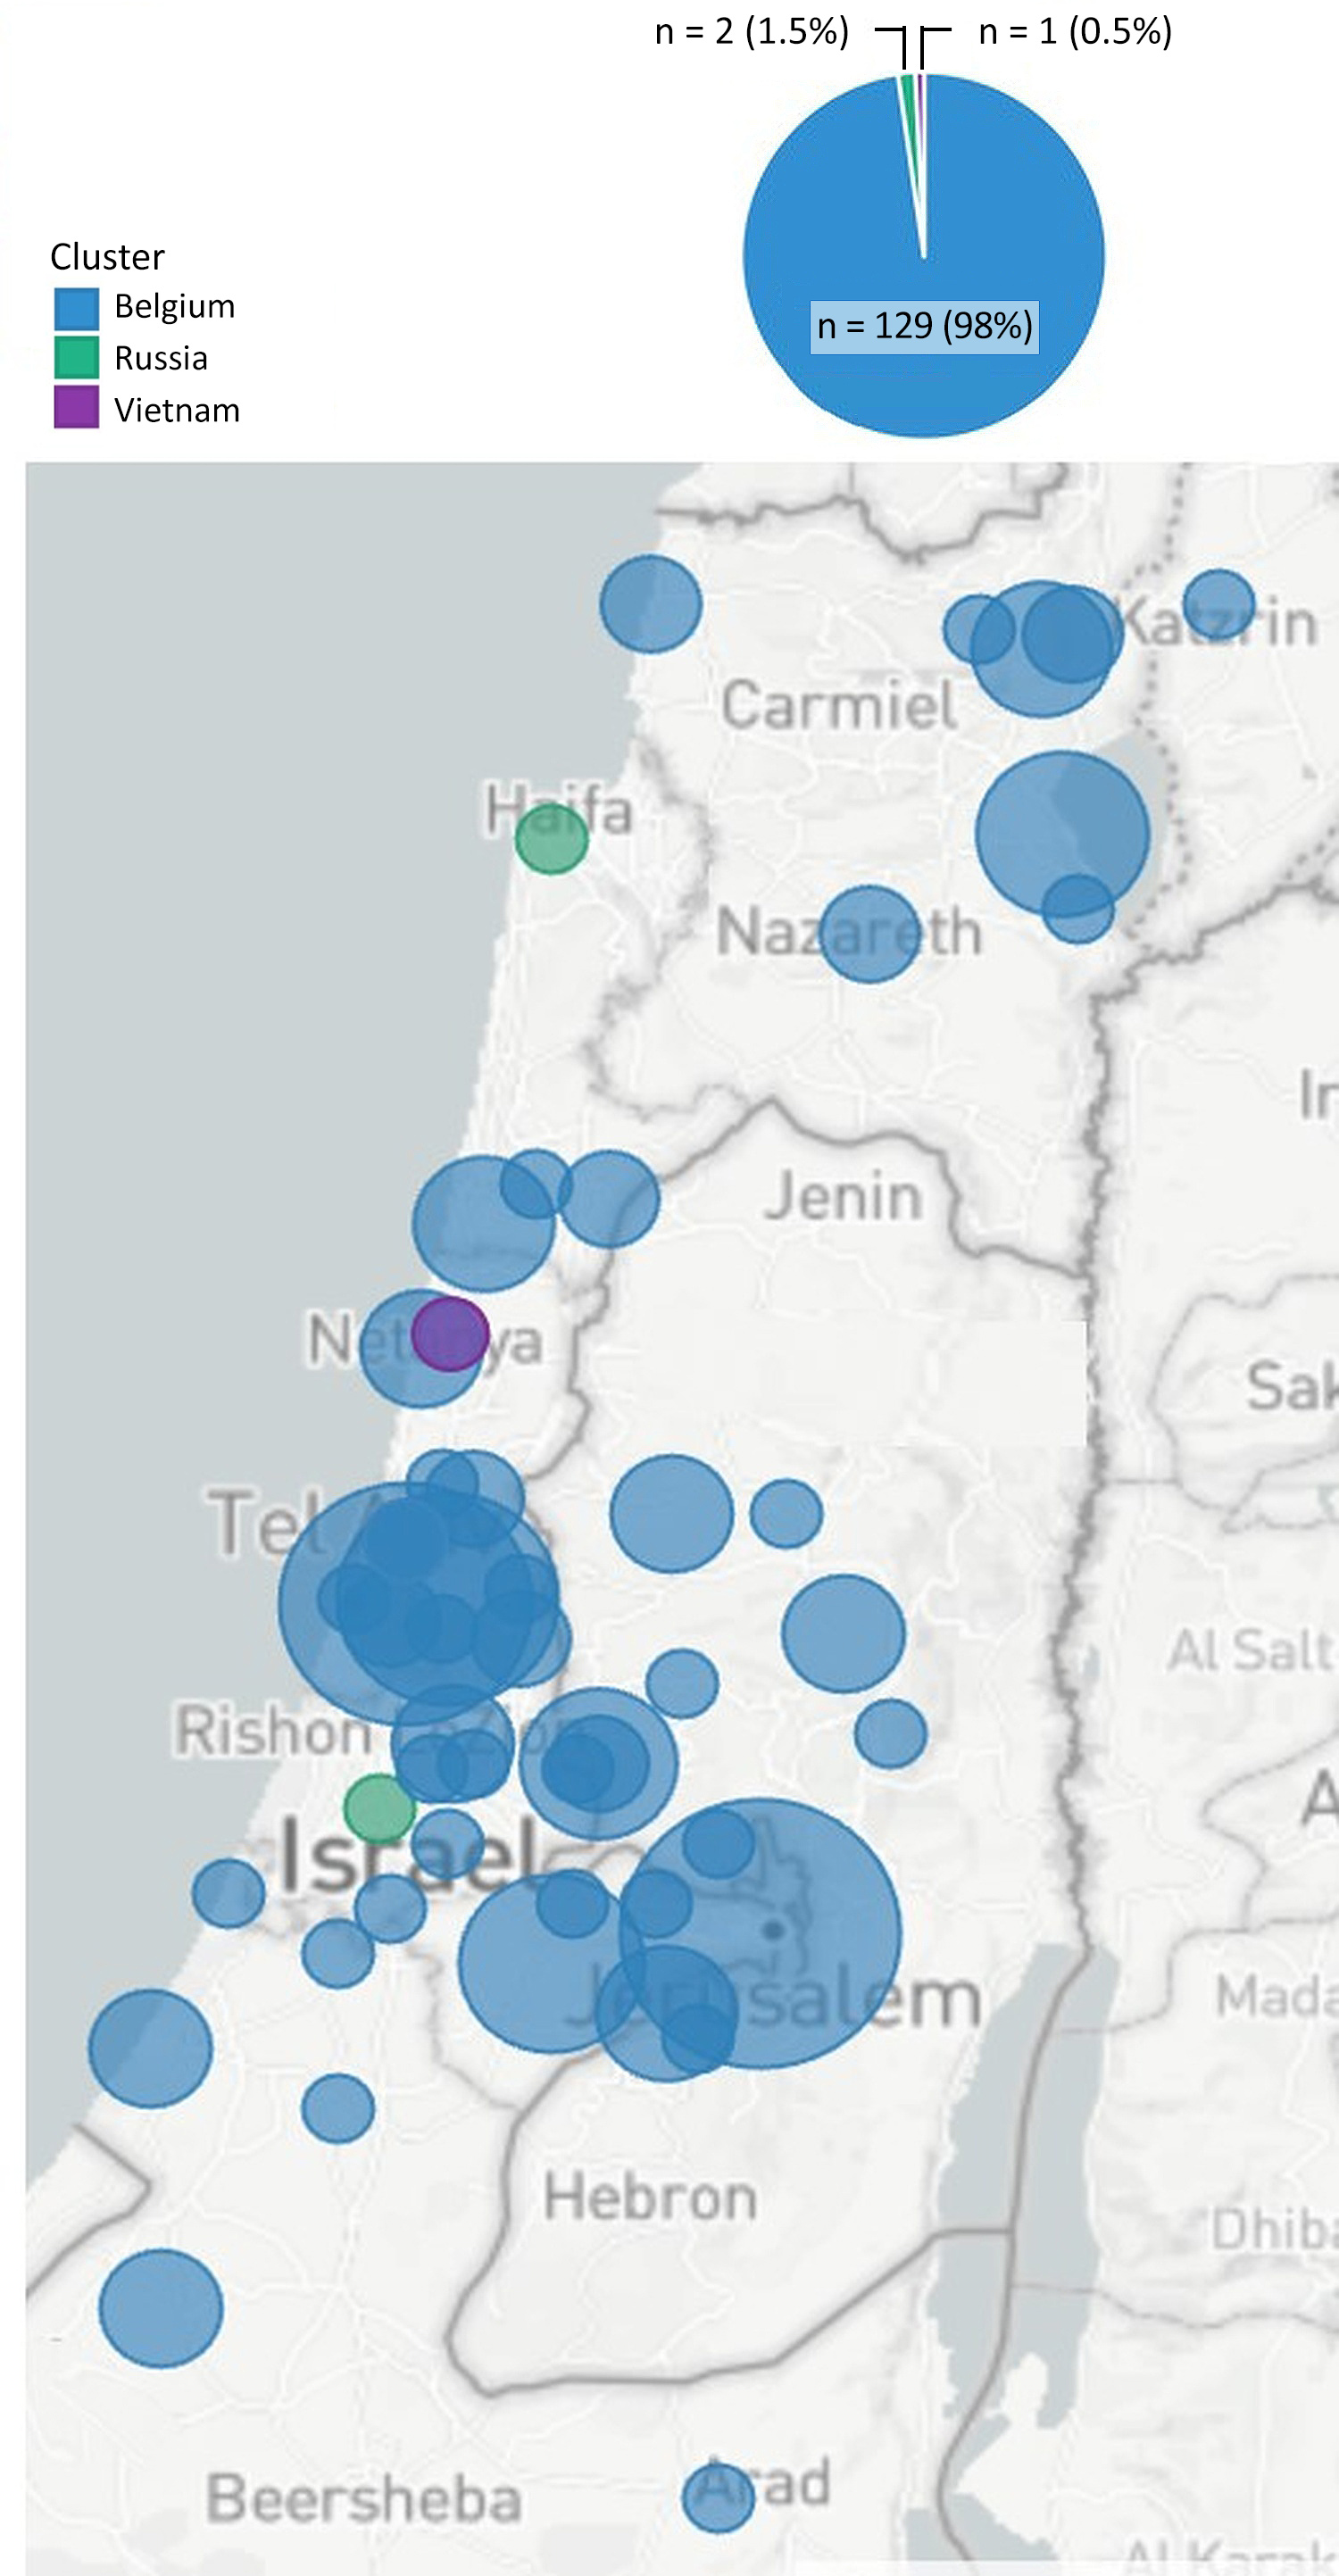
Figure 2. Geographic distribution of sequenced measles cases and importation clusters from genomic and epidemiologic investigation into ongoing measles outbreak, Israel, 2025–2026. Map displays the geographic distribution of sequenced cases by city. Colors denote the 3 major identified importation clusters, and the accompanying pie chart represents the percentage of sequenced samples belonging to each outbreak cluster; number of samples sequenced out of 132 total samples are shown.
1These authors contributed equally to this manuscript.
2Group members are listed at the end of the article.
Page created: July 24, 2026
Page updated: August 26, 2026
Page reviewed: August 26, 2026
The conclusions, findings, and opinions expressed by authors contributing to this journal do not necessarily reflect the official position of the U.S. Department of Health and Human Services, the Public Health Service, the Centers for Disease Control and Prevention, or the authors' affiliated institutions. Use of trade names is for identification only and does not imply endorsement by any of the groups named above.