Volume 5, Number 1—February 1999
Research
Statistical Sensitivity for Detection of Spatial and Temporal Patterns in Rodent Population Densities
Figure 4
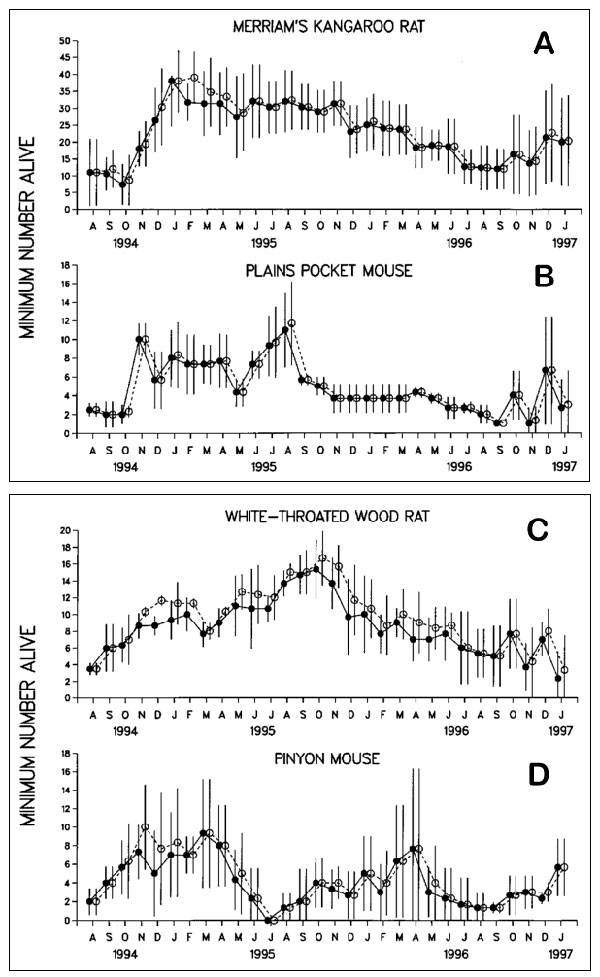
Figure 4. Mean minimum number alive (MNA) values of "observed" (solid circles) and "hypothetical" (open circles) for the following: A. Merriam's kangaroo rat (Dipodomys merriami); B. Plains pocket mouse (Perognathus flavescens); C. White-throated wood rat (Neotoma albigula) at the Sevilleta National Wildlife Refuge study site; D. Pinyon mouse (Peromyscus truei) at the Placitas study site. Values are means of three replicate trapping sites; error bars represent one standard deviation.
Page created: December 10, 2010
Page updated: December 10, 2010
Page reviewed: December 10, 2010
The conclusions, findings, and opinions expressed by authors contributing to this journal do not necessarily reflect the official position of the U.S. Department of Health and Human Services, the Public Health Service, the Centers for Disease Control and Prevention, or the authors' affiliated institutions. Use of trade names is for identification only and does not imply endorsement by any of the groups named above.