Volume 5, Number 5—October 1999
Research
The Economic Impact of Pandemic Influenza in the United States: Priorities for Intervention
Martin I. Meltzer , Nancy J. Cox, and Keiji Fukuda
Figure 2
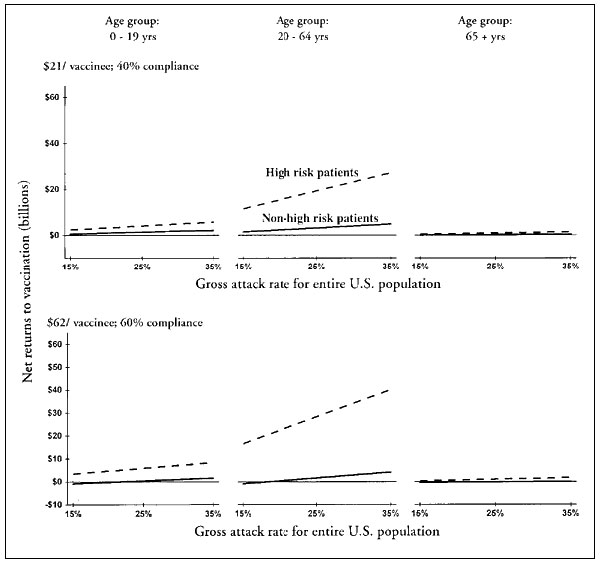
Figure 2. Mean net returns due to vaccination, by age group, for different gross attack rates and percentages of compliance. Case-age distributions are given in Table 1. Assumed vaccine effectiveness is the same as the high vaccine effectiveness defined in Appendix 1.
Page created: December 15, 2010
Page updated: December 15, 2010
Page reviewed: December 15, 2010
The conclusions, findings, and opinions expressed by authors contributing to this journal do not necessarily reflect the official position of the U.S. Department of Health and Human Services, the Public Health Service, the Centers for Disease Control and Prevention, or the authors' affiliated institutions. Use of trade names is for identification only and does not imply endorsement by any of the groups named above.