Volume 6, Number 3—June 2000
Research
Remote Sensing and Geographic Information Systems: Charting Sin Nombre Virus Infections in Deer Mice
John D. Boone* , Kenneth C. McGwire†, Elmer W. Otteson*, Robert S. DeBaca†, Edward A. Kuhn*, Pascal Villard*, Peter F. Brussard*, and Stephen C. St. Jeor*
Figure 2
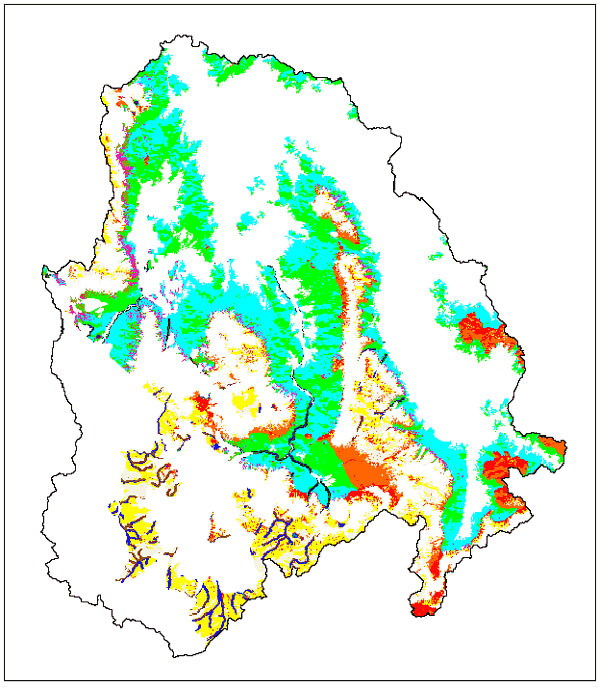
Figure 2. Environmental strata within the mapped extent of the sagebrush-grass scrub vegetation type. Each color represents a unique combination of high or low vegetation density index, standard deviation of vegetation density index, slope, elevation, and distance from stream. White areas represent the other seven vegetation types (strata not shown).
Page created: December 16, 2010
Page updated: December 16, 2010
Page reviewed: December 16, 2010
The conclusions, findings, and opinions expressed by authors contributing to this journal do not necessarily reflect the official position of the U.S. Department of Health and Human Services, the Public Health Service, the Centers for Disease Control and Prevention, or the authors' affiliated institutions. Use of trade names is for identification only and does not imply endorsement by any of the groups named above.