Volume 9, Number 2—February 2003
Research
Applying Network Theory to Epidemics: Control Measures for Mycoplasma pneumoniae Outbreaks
Lauren Ancel Meyers*† , M.E.J. Newman*‡, Michael Martin§, and Stephanie Schrag§
Figure 6
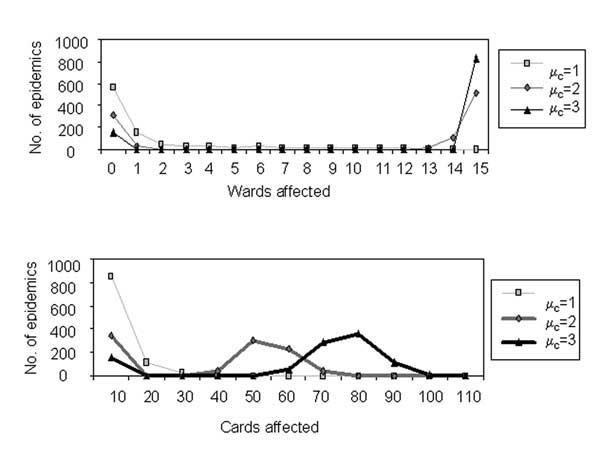
Figure 6. . Simulated outbreak sizes. Frequency distributions of the numbers of wards and caregivers affected in 1,000 epidemic simulations are shown for μc= 1,2,3.
1We calculate these rates by averaging the fraction of infected patients per ward across the 15 wards and compute the error by taking the standard deviation of these fractions, divided by the square root of the sample size.
Page created: April 20, 2012
Page updated: April 20, 2012
Page reviewed: April 20, 2012
The conclusions, findings, and opinions expressed by authors contributing to this journal do not necessarily reflect the official position of the U.S. Department of Health and Human Services, the Public Health Service, the Centers for Disease Control and Prevention, or the authors' affiliated institutions. Use of trade names is for identification only and does not imply endorsement by any of the groups named above.