Volume 13, Number 7—July 2007
Research
Effects of Internal Border Control on Spread of Pandemic Influenza
James G. Wood*† , Nasim Zamani†, C. Raina MacIntyre*†, and Niels G. Becker‡
Figure 3
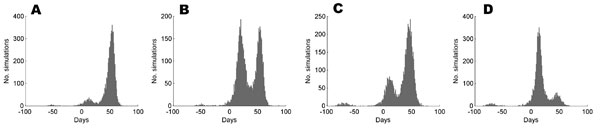
Figure 3. Distributions, based on 10,000 simulations, of the time delay, T20, given reproduction number (R0) = 1.5 and the peaked infectivity function, with 99% travel restrictions imposed in scenario 1 (A) and (B) and scenario 2 (C) and (D). Scenario 1 simulates an epidemic beginning in Sydney and spreading to Melbourne. In scenario 2, the epidemic begins in Darwin and spreads to Sydney. In (A) and (C), the restrictions are imposed after 2 weeks; in (B) and (D), they are imposed after 4 weeks.
Page created: June 24, 2010
Page updated: June 24, 2010
Page reviewed: June 24, 2010
The conclusions, findings, and opinions expressed by authors contributing to this journal do not necessarily reflect the official position of the U.S. Department of Health and Human Services, the Public Health Service, the Centers for Disease Control and Prevention, or the authors' affiliated institutions. Use of trade names is for identification only and does not imply endorsement by any of the groups named above.