Skip directly to site content Skip directly to page options Skip directly to A-Z link Skip directly to A-Z link Skip directly to A-Z link
Volume 13, Number 7—July 2007
Dispatch

Virus Detection and Monitoring of Viral Load in Crimean-Congo Hemorrhagic Fever Virus Patients

Roman Wölfel*†, Janusz T. Paweska‡, Nadine Petersen†, Antoinette A. Grobbelaar‡, Patricia A. Leman‡, Roger Hewson§, Marie-Claude Georges-Courbot¶, Anna Papa#, Stephan Günther†, and Sung Sup Park†Comments to Author 
Author affiliations: *Bundeswehr Institute of Microbiology, Munich, Germany; †Bernhard Nocht Institute for Tropical Medicine, Hamburg, Germany; ‡National Institute for Communicable Diseases, Sandringham, South Africa; §Health Protection Agency, Porton Down, Salisbury, United Kingdom; ¶Institute Pasteur, Lyon, France; #Aristotle University of Thessaloniki, Thessaloniki, Greece;

Main Article

Figure 2

Clinical evaluation. Upper panel: plasma viral load over time in 44 samples from 17 patients. Samples from patients who died are marked with a filled square. Lower panel: plasma viral load in relation to antibody status in 16 samples with and 27 samples without detectable immunoglobulin G (IgG) antibodies. Only IgG status was taken as reference because only 2 patients had IgM without IgG. The difference of means between the 2 groups was highly significant (t test, p = 0.00005). Boxes indicate 25th through 75th percentiles; error bars indicate 5th and 95th percentiles. A) Oligonucleotides. The Figure 1 shows oligonucleotide binding sites from representative strains taken from the full CCHFV alignment used for assay design. The full alignment can be accessed at www.bni-hamburg.de. All sequences show the plus (coding) sense cDNA (i.e., the reverse complement of virus RNA). The forward primer RWCF and probes SE01 and SE03 are located on the plus strand. The reverse primer RWCR and probe SE0A are located on the minus strand. B) Analytical evaluation. Left and middle panel: amplification of a representative set of virus RNA (strain identity in legend) with probe SE01 only (left panel) and with the full set of 3 probes (middle). Note that all strains were detected with probe SE01 alone, but some strains showed weak signal. The additional probes increased the signal for such weak strains without lowering the signal for others. The 2 completely flat lines on both panels are negative controls. Left panel: probit analysis performed with the final assay protocol. The x-axis shows the calculated input concentration of synthetic virus RNA of strain BT-958 (EF123122), the y-axis shows the observed hit rates in 5 replicate reactions per concentration and the calculated detection probabilities according to the dose-response model. Upper and lower curves represent 95% confidence limits of the model. C) Clinical evaluation. Left panel: plasma viral load over time in 44 samples from 17 patients. Samples from patients who died are marked with a filled square. Right panel: plasma viral load in relation to antibody status in 16 samples with and 27 samples without detectable IgG antibodies. Only IgG status was taken as reference because only 2 patients had IgM without IgG. The difference of means between the 2 groups was highly significant (t test, p = 0.00005). Boxes indicate 25th through 75th percentiles; error bars indicate 5th and 95th percentiles. CCHFV, Crimean-Congo hemorrhagic fever virus.

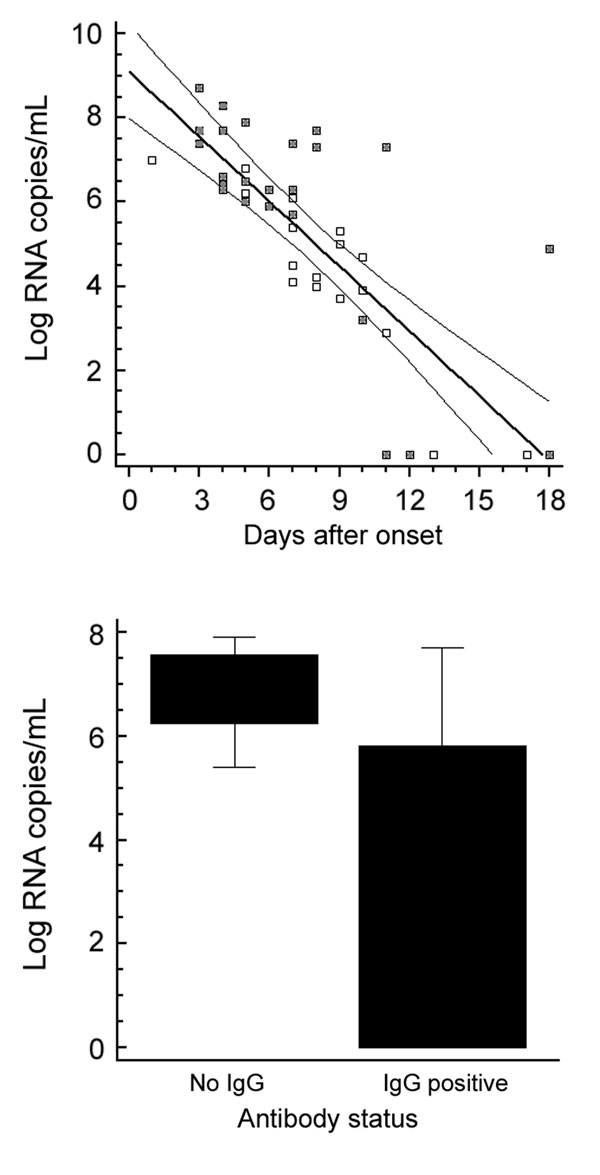
Figure 2. Clinical evaluation. Upper panel: plasma viral load over time in 44 samples from 17 patients. Samples from patients who died are marked with a filled square. Lower panel: plasma viral load in relation to antibody status in 16 samples with and 27 samples without detectable immunoglobulin G (IgG) antibodies. Only IgG status was taken as reference because only 2 patients had IgM without IgG. The difference of means between the 2 groups was highly significant (t test, p = 0.00005). Boxes indicate 25th through 75th percentiles; error bars indicate 5th and 95th percentiles. A) Oligonucleotides. The Figure 1 shows oligonucleotide binding sites from representative strains taken from the full CCHFV alignment used for assay design. The full alignment can be accessed at www.bni-hamburg.de. All sequences show the plus (coding) sense cDNA (i.e., the reverse complement of virus RNA). The forward primer RWCF and probes SE01 and SE03 are located on the plus strand. The reverse primer RWCR and probe SE0A are located on the minus strand. B) Analytical evaluation. Left and middle panel: amplification of a representative set of virus RNA (strain identity in legend) with probe SE01 only (left panel) and with the full set of 3 probes (middle). Note that all strains were detected with probe SE01 alone, but some strains showed weak signal. The additional probes increased the signal for such weak strains without lowering the signal for others. The 2 completely flat lines on both panels are negative controls. Left panel: probit analysis performed with the final assay protocol. The x-axis shows the calculated input concentration of synthetic virus RNA of strain BT-958 (EF123122), the y-axis shows the observed hit rates in 5 replicate reactions per concentration and the calculated detection probabilities according to the dose-response model. Upper and lower curves represent 95% confidence limits of the model. C) Clinical evaluation. Left panel: plasma viral load over time in 44 samples from 17 patients. Samples from patients who died are marked with a filled square. Right panel: plasma viral load in relation to antibody status in 16 samples with and 27 samples without detectable IgG antibodies. Only IgG status was taken as reference because only 2 patients had IgM without IgG. The difference of means between the 2 groups was highly significant (t test, p = 0.00005). Boxes indicate 25th through 75th percentiles; error bars indicate 5th and 95th percentiles. CCHFV, Crimean-Congo hemorrhagic fever virus.

Main Article

Page created: June 21, 2010
Page updated: June 21, 2010
Page reviewed: June 21, 2010
The conclusions, findings, and opinions expressed by authors contributing to this journal do not necessarily reflect the official position of the U.S. Department of Health and Human Services, the Public Health Service, the Centers for Disease Control and Prevention, or the authors' affiliated institutions. Use of trade names is for identification only and does not imply endorsement by any of the groups named above.
file_external