Volume 14, Number 4—April 2008
Research
Wild Ducks as Long-Distance Vectors of Highly Pathogenic Avian Influenza Virus (H5N1)
Figure 2

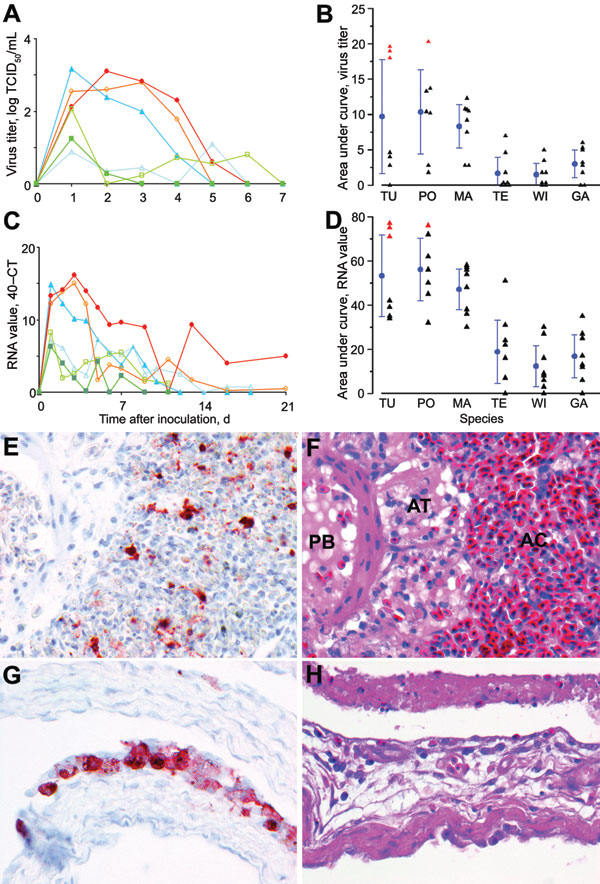
Figure 2. Mean pharyngeal excretion of highly pathogenic avian influenza virus (H5N1) of wild ducks by A) virus isolation and C) reverse transcription–PCR (RT-PCR). Pochard (red, closed circle), tufted duck (orange, open circle), mallard (dark blue, closed triangle), teal (light blue, open triangle), wigeon (dark green, closed square), gadwall (light green, open square); TCID50, median tissue culture infectious dose; Ct, cycle threshold. Area under the curve in the first 4 days postinoculation (mean ± 95% confidence interval) for B) virus isolation and D) RT-PCR. TU, tufted duck; PO, pochard; MA, mallard; TE, teal; WI, wigeon; GA, gadwall; red triangles, birds with severe clinical signs; black triangles, birds with mild or no clinical signs. E) Influenza virus antigen expression in epithelial cells in bronchus, parabronchus, atrium, and air capillaries of a tufted duck. F) Bronchointerstitial pneumonia, characterized by flooding of parabronchi (PB), atria (AT), and air capillaries (AC) with proteinaceous fluid and inflammatory cells in a tufted duck. G) Influenza virus antigen expression in epithelial cells lining the air sac wall and H) epithelial necrosis and lymphocytic infiltration in a gadwall. E–H original magnification ×100. Tissues were stained either by immunohistochemistry that used a monoclonal antibody against the nucleoprotein of influenza A virus as a primary antibody (E, G) or with hematoxylin and eosin (F, H).