Skip directly to site content Skip directly to page options Skip directly to A-Z link Skip directly to A-Z link Skip directly to A-Z link
Volume 24, Number 12—December 2018
Research

Terrestrial Bird Migration and West Nile Virus Circulation, United States

Daniele Swetnam, Steven G. Widen, Thomas G. Wood, Martin Reyna, Lauren Wilkerson, Mustapha Debboun, Dreda A. Symonds, Daniel G. Mead, Barry J. Beaty, Hilda Guzman, Robert B. Tesh, and Alan D.T. BarrettComments to Author 
Author affiliations: University of California at Davis, Davis, California, USA (D. Swetnam); University of Texas Medical Branch, Galveston, Texas, USA (D. Swetnam, S.G. Widen, T.G. Wood, H. Guzman, R.B. Tesh, A.D.T. Barrett); Harris County Public Health, Houston, Texas, USA (M. Reyna, L. Wilkerson, M. Debboun); Chesapeake Mosquito Control Commission, Chesapeake, Virginia, USA (D.A. Symonds); University of Georgia, Athens, Georgia, USA (D.G. Mead); Colorado State University, Fort Collins, Colorado, USA (B.J. Beaty)

Main Article

Figure 1

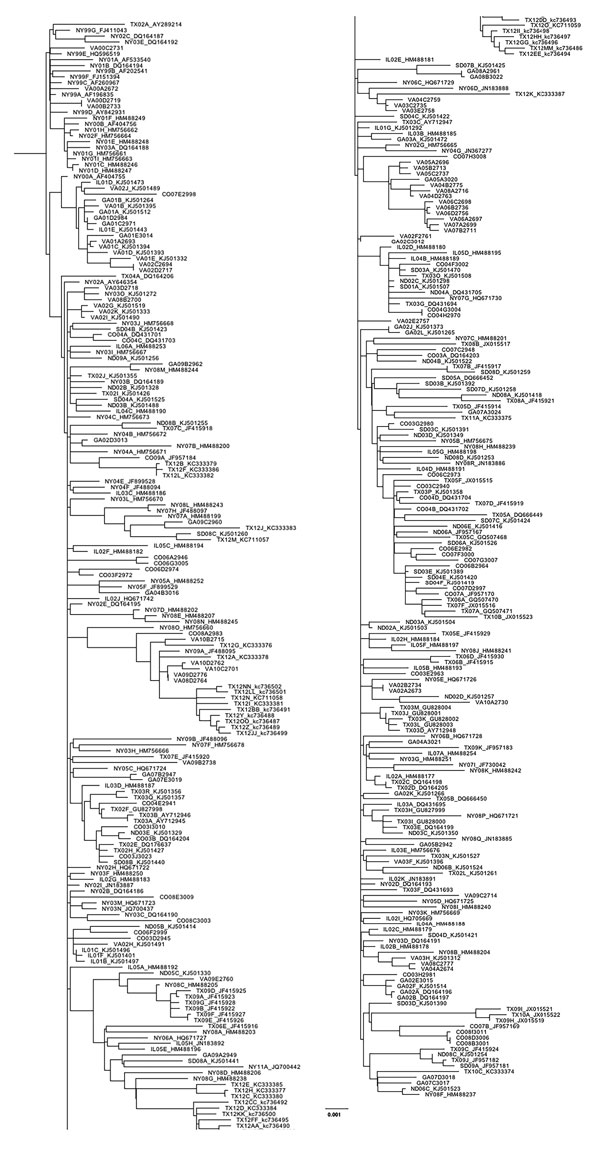
Maximum-likelihood phylogeny generated with all West Nile virus sequences from New York, Virginia, Georgia, Illinois, North Dakota, South Dakota, Texas, and Colorado (n = 379) in study of terrestrial bird migration and West Nile virus circulation, United States. Sequence names include the 2-letter state abbreviation to indicate the origin of isolation, followed by the year. Multiple isolates collected from the same state within the same year are differentiated by letter. GenBank accession number

Figure 1. Maximum-likelihood phylogeny generated with all West Nile virus sequences from New York, Virginia, Georgia, Illinois, North Dakota, South Dakota, Texas, and Colorado (n = 379) in study of terrestrial bird migration and West Nile virus circulation, United States. Sequence names include the 2-letter state abbreviation to indicate the origin of isolation, followed by the year. Multiple isolates collected from the same state within the same year are differentiated by letter. GenBank accession numbers are provided for all taxa that were not sequenced in this study. Scale bar indicates nucleotide substitutions per site.

Main Article

Page created: November 20, 2018
Page updated: November 20, 2018
Page reviewed: November 20, 2018
The conclusions, findings, and opinions expressed by authors contributing to this journal do not necessarily reflect the official position of the U.S. Department of Health and Human Services, the Public Health Service, the Centers for Disease Control and Prevention, or the authors' affiliated institutions. Use of trade names is for identification only and does not imply endorsement by any of the groups named above.
file_external