Volume 24, Number 12—December 2018
Research
Terrestrial Bird Migration and West Nile Virus Circulation, United States
Daniele Swetnam, Steven G. Widen, Thomas G. Wood, Martin Reyna, Lauren Wilkerson, Mustapha Debboun, Dreda A. Symonds, Daniel G. Mead, Barry J. Beaty, Hilda Guzman, Robert B. Tesh, and Alan D.T. Barrett
Figure 5
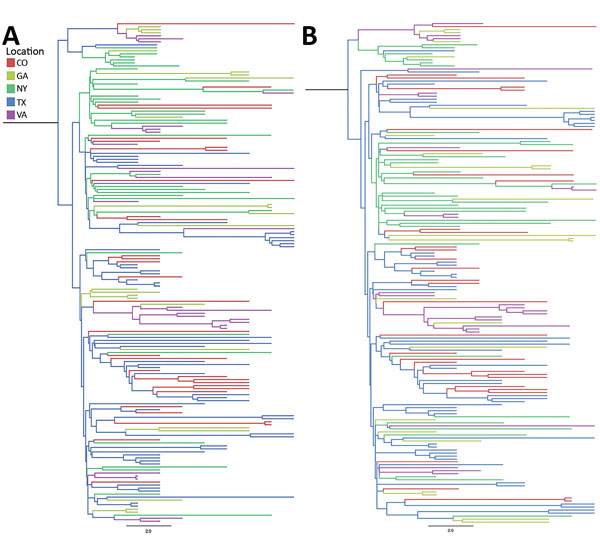
Figure 5. Incidence-controlled phylogeny of Eastern and Central flyways, United States. Sequences were down-sampled such that the number of sequences was proportional to the annual incidence of West Nile neurologic disease incidence for each location between 2001 and 2009. Down-sampling was undertaken twice (A and B) to ensure that the reduction in sequences did not result in a substantial loss of diversity. Illinois, North Dakota, and South Dakota were not included in the incidence-control analysis because too few sequences were available to support down-sampling. Bayesian approaches were used to generate maximum-clade credibility trees. Scale bars indicate nucleotide substitutions per site.
Page created: November 20, 2018
Page updated: November 20, 2018
Page reviewed: November 20, 2018
The conclusions, findings, and opinions expressed by authors contributing to this journal do not necessarily reflect the official position of the U.S. Department of Health and Human Services, the Public Health Service, the Centers for Disease Control and Prevention, or the authors' affiliated institutions. Use of trade names is for identification only and does not imply endorsement by any of the groups named above.