Volume 24, Number 12—December 2018
Research
Terrestrial Bird Migration and West Nile Virus Circulation, United States
Daniele Swetnam, Steven G. Widen, Thomas G. Wood, Martin Reyna, Lauren Wilkerson, Mustapha Debboun, Dreda A. Symonds, Daniel G. Mead, Barry J. Beaty, Hilda Guzman, Robert B. Tesh, and Alan D.T. Barrett
Figure 6
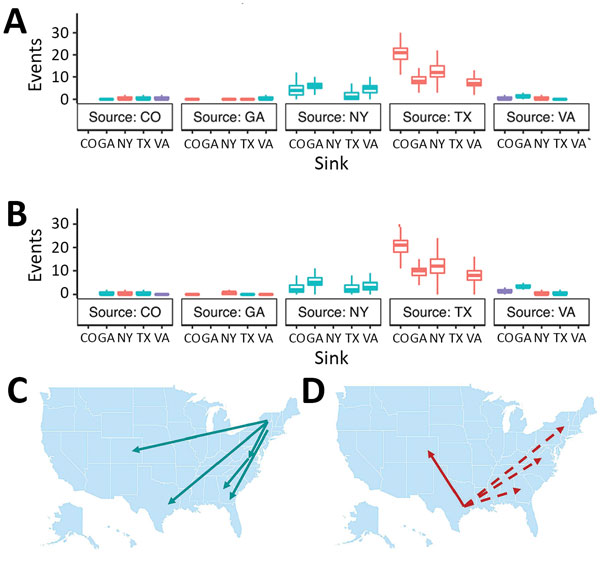
Figure 6. Summary of Markov jump analysis performed on the incident-controlled phylogeny. A, B) The results of the Markov jump analysis for each down-sampled dataset are summarized as box plots. Box tops indicate third quartiles, box bottoms indicate first quartiles; horizontal bars within boxes indicate medians; error bars indicate maximums and minimums. Red, northward movement; teal, southward movement; purple, movement that is neither north nor south; dotted arrows, movement that was not observed in the incident-controlled down-sampling because of an insufficient number of sequences. C, D) Movement originating in the eastern and central United States. Only Markov jumps that occurred >2 times are depicted.
Page created: November 20, 2018
Page updated: November 20, 2018
Page reviewed: November 20, 2018
The conclusions, findings, and opinions expressed by authors contributing to this journal do not necessarily reflect the official position of the U.S. Department of Health and Human Services, the Public Health Service, the Centers for Disease Control and Prevention, or the authors' affiliated institutions. Use of trade names is for identification only and does not imply endorsement by any of the groups named above.