Volume 14, Number 11—November 2008
Dispatch
Possible New Hepatitis B Virus Genotype, Southeast Asia
Christophe M. Olinger, Prapan Jutavijittum, Judith M. Hübschen, Amnat Yousukh, Bounthome Samountry, Te Thammavong, Kan Toriyama, and Claude P. Muller
Figure 1
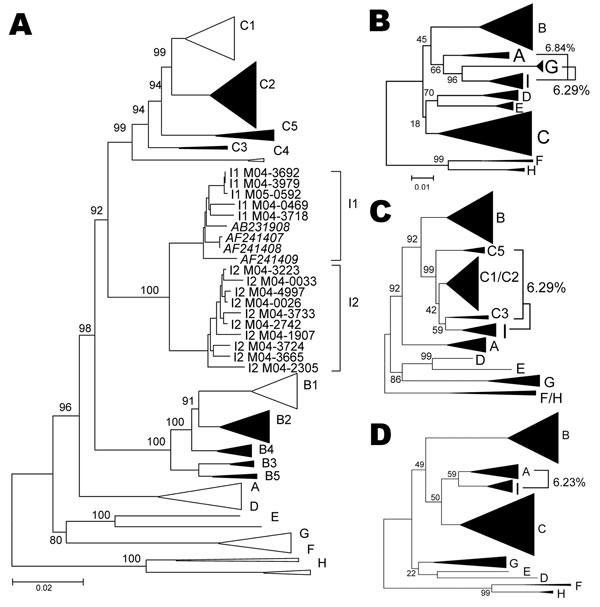
Figure 1. A) Phylogenetic comparison of all complete genotype I genomes (n = 15) obtained and compared to sequences of all known genotypes and subgenotypes. Non–genotype I genotypes identified in Lao People’s Democratic Republic in the present study are shown as full triangles. Numbers indicate bootstrap values of important nodes. B–D) Phylogenetic comparison of positions 400–1400 (left), 1400–3000 (middle), and 3000–400 (right), of all genotype I strains with all known genotypes and subgenotypes. Percentages indicate average genetic distances between genotype I and G, C, or A, respectively. Scale bars indicate number of substitutions per site.
Page created: July 18, 2010
Page updated: July 18, 2010
Page reviewed: July 18, 2010
The conclusions, findings, and opinions expressed by authors contributing to this journal do not necessarily reflect the official position of the U.S. Department of Health and Human Services, the Public Health Service, the Centers for Disease Control and Prevention, or the authors' affiliated institutions. Use of trade names is for identification only and does not imply endorsement by any of the groups named above.