Volume 15, Number 12—December 2009
Research
Landscape Epidemiology of Tularemia Outbreaks in Sweden
Figure 7
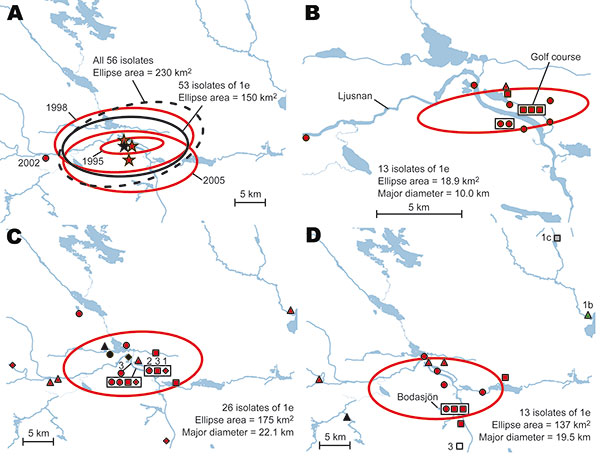
Figure 7. A) Directional distributions of tularemia transmission sites in Ljusdal, Sweden, by outbreak year (red ellipses). The Francisella tularensis isolates recovered from patients in Ljusdal were genetically monomorphic, with 53/56 isolates belonging to genetic subgroup 1e (solid black ellipse). The dashed black ellipse represents the distributions of all 56 isolates. Each ellipse represents a 1 standard deviation distribution around the mean centers of occurrence (starred). B) Distributions of 13 isolates of genetic group 1e, genotype identification (ID) 15 (red), Ljusdal, 1995. C) Distributions of 26 isolates of genetic group 1e, genotype ID 15 (red) and genotype ID 16 (black), Ljusdal, 1998. Numbers above symbols indicate multiple data points. D) Distributions of 13 isolates of genetic group 1e, genotype ID 15 (red) and genotype ID 16 (black); genetic group 1b (green); genetic group 1c (gray); and genetic group 3 (white), Ljusdal, 2005. Spatial data quality assessment for each pair of coordinates is shown as certain (circle), probable (square), or possible (diamond); patient residency (triangle) was used when transmission data were unavailable.