Skip directly to site content Skip directly to page options Skip directly to A-Z link Skip directly to A-Z link Skip directly to A-Z link
Volume 16, Number 11—November 2010
Research

Genetic Structure of Plasmodium falciparum and Elimination of Malaria, Comoros Archipelago

Stanislas Rebaudet1, Hervé Bogreau1, Rahamatou Silaï, Jean-François Lepère, Lionel Bertaux, Bruno Pradines, Jean Delmont, Philippe Gautret, Philippe Parola, and Christophe RogierComments to Author 
Author affiliations: Institute for Biomedical Research of the French Army, Marseille, France (S. Rebaudet, H. Bogreau, L. Bertaux, B. Pradines, C. Rogier); Université de la Méditerranée, Marseille (J. Delmont, P. Parola); Assistance Publique–Hôpitaux de Marseille, Marseille (P. Gautret); Programme National de Lutte contre le Paludisme, Moroni, Comoros (R. Silaï); Dispensaire de Bandraboua, Mayotte, France (J.-F. Lepère); 1These authors contributed equally to this article.

Main Article

Figure 1

Results of canonical correspondence analysis (CCA) of Plasmodium falciparum populations from the islands of Grande Comore (GC), Moheli (MOH), Anjouan (ANJ), and Mayotte (MAY) and from Marseille, France (MARS), according to 6 microsatellite loci. CCA is used as a 2-dimensional representation of genetic distance between plasmodial populations assessed from 6 microsatellite loci (Pf2689, C4M79, Pf2802, 7A11, TRAP, and C4M69). This representation requires the projection of data from 6-dimensional sp

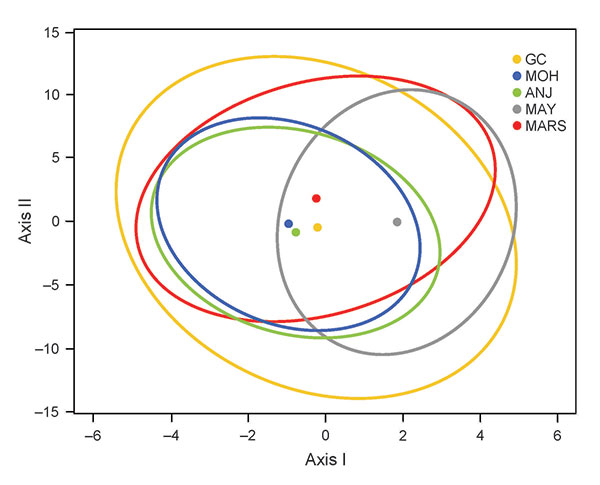
Figure 1. Results of canonical correspondence analysis (CCA) of Plasmodium falciparum populations from the islands of Grande Comore (GC), Moheli (MOH), Anjouan (ANJ), and Mayotte (MAY) and from Marseille, France (MARS), according to 6 microsatellite loci. CCA is used as a 2-dimensional representation of genetic distance between plasmodial populations assessed from 6 microsatellite loci (Pf2689, C4M79, Pf2802, 7A11, TRAP, and C4M69). This representation requires the projection of data from 6-dimensional space to 2-dimensional space. Canonical axes I and II of the new 2-dimensional space are calculated to conserve the highest genetic variance between populations after projection of data, and their significance was tested by Monte Carlo permutation that also enabled estimation of the 95% confidence intervals (ellipses) of the centroid (dots) of each population.

Main Article

Page created: March 08, 2011
Page updated: March 08, 2011
Page reviewed: March 08, 2011
The conclusions, findings, and opinions expressed by authors contributing to this journal do not necessarily reflect the official position of the U.S. Department of Health and Human Services, the Public Health Service, the Centers for Disease Control and Prevention, or the authors' affiliated institutions. Use of trade names is for identification only and does not imply endorsement by any of the groups named above.
file_external