Skip directly to site content Skip directly to page options Skip directly to A-Z link Skip directly to A-Z link Skip directly to A-Z link
Volume 17, Number 3—March 2011
Research

Monitoring and Characterization of Oseltamivir-Resistant Pandemic (H1N1) 2009 Virus, Japan, 2009–2010

Makoto Ujike, Miho Ejima, Akane Anraku, Kozue Shimabukuro, Masatsugu Obuchi, Noriko Kishida, Xu Hong, Emi Takashita, Seiichiro Fujisaki, Kazuyo Yamashita, Hiroshi Horikawa, Yumiko Kato, Akio Oguchi, Nobuyuki Fujita, Masato Tashiro, Takato OdagiriComments to Author , and the Influenza Virus Surveillance Group of Japan
Author affiliations: Author affiliations: National Institute of Infectious Diseases, Tokyo, Japan (M. Ujike, M. Ejima, A. Anraku, K. Shimabukuro, M. Obuchi, N. Kishida, X. Hong, E. Takashita, S. Fujisaki, K. Yamashita, M. Tashiro, T. Odagiri); National Institute of Technology and Evaluation, Tokyo (H. Horikawa, Y. Kato, A. Oguchi, N. Fujita)

Main Article

Figure A1

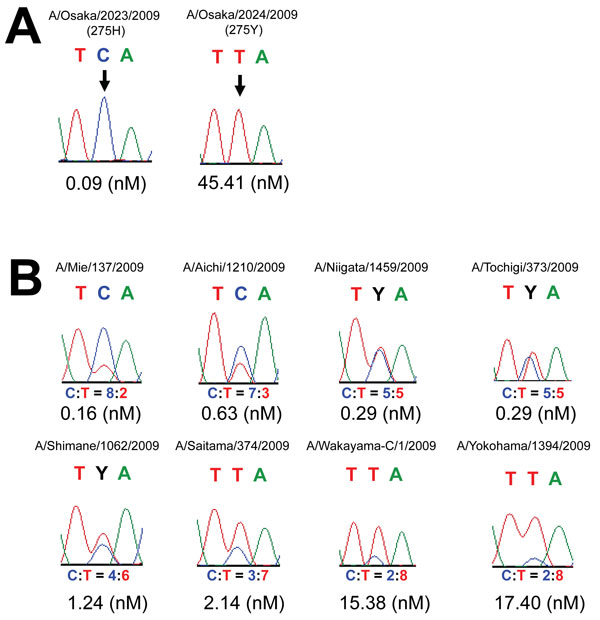
The relationship between sequence wave patterns and 50% inhibitory concentration (IC50) values of representative oseltamivir-susceptible (OS) and oseltamivir-resistant (OR) pandemic (H1N1) 2009 viruses and mixed viruses. A) Neuraminidase (NA) sequences and IC50 values of OS- (A/OSAKA/2023/2009, 275H) and OR pandemic (H1N1) 2009 (A/OSAKA/2024/2009, 275Y). The codon TCA (amino acid H at position 275 in NA protein) of OS pandemic (H1N1) 2009 changed to TTA (Y) in OS pandemic (H1N1) 2009 (arrow). Al

Figure A1. The relationship between sequence wave patterns and 50% inhibitory concentration (IC50) values of representative oseltamivir-susceptible (OS) and oseltamivir-resistant (OR) pandemic (H1N1) 2009 viruses and mixed viruses. A) Neuraminidase (NA) sequences and IC50 values of OS- (A/OSAKA/2023/2009, 275H) and OR pandemic (H1N1) 2009 (A/OSAKA/2024/2009, 275Y). The codon TCA (amino acid H at position 275 in NA protein) of OS pandemic (H1N1) 2009 changed to TTA (Y) in OS pandemic (H1N1) 2009 (arrow). Almost all viruses tested showed a single wave pattern at this position. IC50 values and the C:T signal ratio are indicated below each sequence. B) NA sequences and IC50 values of representative mixed viruses. Several wave patterns were observed among mixed viruses. The IC50 value of mixed viruses that had a C:T signal ratio of 8:2–5:5 tended to be close to that of OS pandemic (H1N1) 2009 (range 0.16–0.63 nM), while the IC50 values of mixed viruses that had a C:T signal ratio of 2:8 tended to be close to that of OS pandemic (H1N1) 2009 (15.– 17.40 nM). The IC50 values of mixed viruses that had a C:T signal ratio of 4:6–3:7 tended to display middling IC50 values (range 1.24–2.14 nM). In most cases, the C:T signal ratios of mixed viruses were correlated with IC50 values.

Main Article

1Members of the Influenza Virus Surveillance Group of Japan are listed at the end of this article.

Page created: July 25, 2011
Page updated: July 25, 2011
Page reviewed: July 25, 2011
The conclusions, findings, and opinions expressed by authors contributing to this journal do not necessarily reflect the official position of the U.S. Department of Health and Human Services, the Public Health Service, the Centers for Disease Control and Prevention, or the authors' affiliated institutions. Use of trade names is for identification only and does not imply endorsement by any of the groups named above.
file_external