Skip directly to site content Skip directly to page options Skip directly to A-Z link Skip directly to A-Z link Skip directly to A-Z link
Volume 17, Number 8—August 2011
Research

Seroprevalence of Trichodysplasia Spinulosa–associated Polyomavirus

Els van der MeijdenComments to Author , Siamaque Kazem, Manda M. Burgers, Rene Janssens, Jan Nico Bouwes Bavinck, Hester E. de Melker, and Mariet C.W. Feltkamp
Author affiliations: Author affiliations: Leiden University Medical Center, Leiden, the Netherlands (E. van der Meijden, S. Kazem, M.M. Burgers, J.N. Bouwes Bavinck, M.C.W. Feltkamp); Jeroen Bosch Ziekenhuis, ‘s Hertogenbosch, the Netherlands (R. Janssens); National Institute of Public Health and the Environment, Bilthoven, the Netherlands (H. de Melker)

Main Article

Figure 7

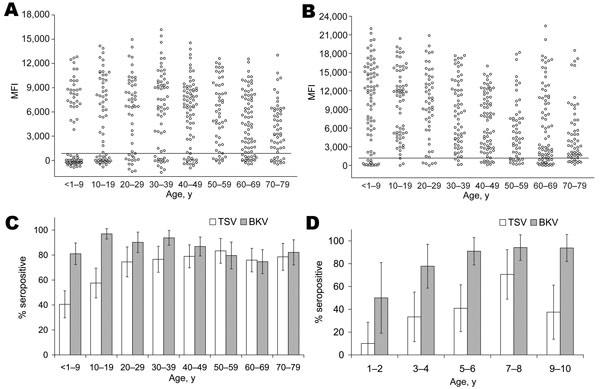
Age-related seroprevalence of trichodysplasia spinulosa–associated polyomavirus (TSV) viral protein 1 (VP1) (A) and BKV polyomavirus VP1 (B) in a healthy population, the Netherlands. The population was divided into 8 age groups: <1–9 years of age (n = 79), 10–19 (n = 66), 20–29 (n = 51), 30–39 (n = 64), 40–49 (n = 76), 50–59 (n = 54), 60–69 (n = 79), and 70–79 (n = 56). Each circle represents 1 serum sample, and the horizontal lines represent cutoff values. MFI, median fluorescent intensity.

Figure 7. Age-related seroprevalence of trichodysplasia spinulosa–associated polyomavirus (TSV) viral protein 1 (VP1) (A) and BKV polyomavirus VP1 (B) in a healthy population, the Netherlands. The population was divided into 8 age groups: <1–9 years of age (n = 79), 10–19 (n = 66), 20–29 (n = 51), 30–39 (n = 64), 40–49 (n = 76), 50–59 (n = 54), 60–69 (n = 79), and 70–79 (n = 56). Each circle represents 1 serum sample, and the horizontal lines represent cutoff values. MFI, median fluorescent intensity. C) Seroprevalence of TSV VP1 (white bars) and BKV VP1 (gray bars), by age. D) Seroprevalence of TSV VP1 and BKV VP1 in youngest age group. Population was divided into 5 smaller age groups: 1–2 years of age (n = 10); 3–4 (n = 18); 5–6 (n = 22); 7–8 (n = 17); 9–10 (n = 16). Error bars indicate 95% confidence intervals.

Main Article

Page created: August 15, 2011
Page updated: August 15, 2011
Page reviewed: August 15, 2011
The conclusions, findings, and opinions expressed by authors contributing to this journal do not necessarily reflect the official position of the U.S. Department of Health and Human Services, the Public Health Service, the Centers for Disease Control and Prevention, or the authors' affiliated institutions. Use of trade names is for identification only and does not imply endorsement by any of the groups named above.
file_external