Volume 18, Number 8—August 2012
Research
Comparison of Enzootic Risk Measures for Predicting West Nile Disease, Los Angeles, California, USA, 2004–2010
Jennifer L. Kwan, Bborie K. Park, Tim E. Carpenter, Van Ngo, Rachel Civen, and William K. Reisen
Figure 2
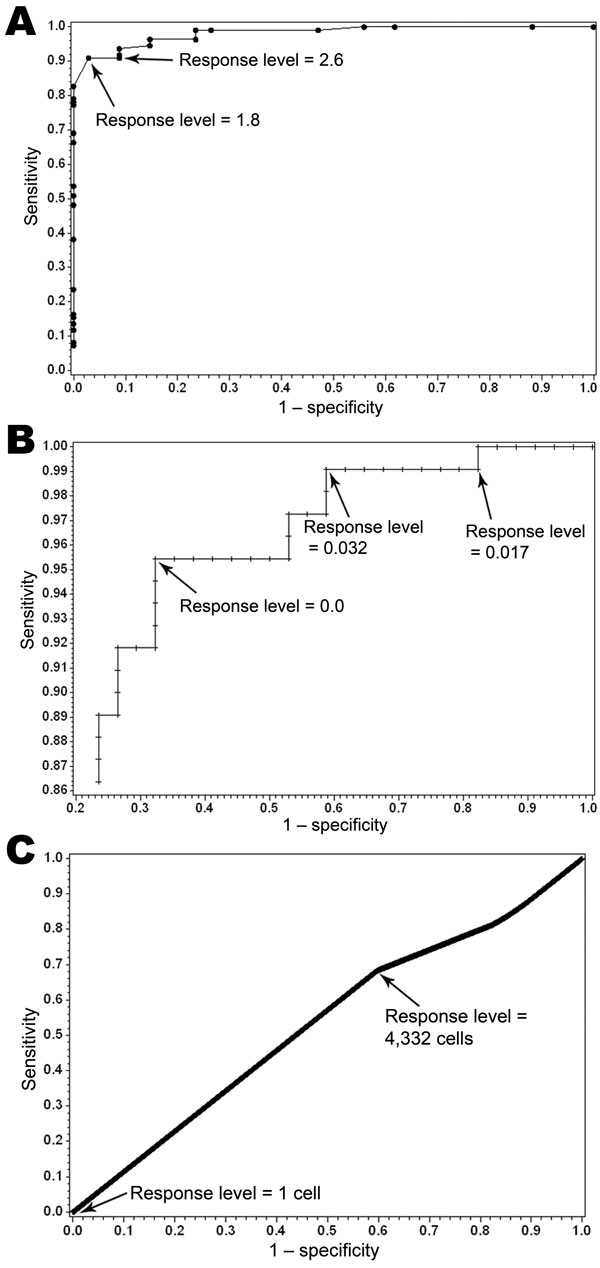
Figure 2. . . Receiver operator characteristic curves for California Mosquito-Borne Virus Risk Assessment (A), vector index (B), and Dynamic Continuous-Area Space-Time system (C), with labeled cutoff points for 2004–2008 data, Los Angeles, California, USA.
Page created: July 18, 2012
Page updated: July 18, 2012
Page reviewed: July 18, 2012
The conclusions, findings, and opinions expressed by authors contributing to this journal do not necessarily reflect the official position of the U.S. Department of Health and Human Services, the Public Health Service, the Centers for Disease Control and Prevention, or the authors' affiliated institutions. Use of trade names is for identification only and does not imply endorsement by any of the groups named above.