Volume 19, Number 12—December 2013
Research
Antiviral Susceptibility of Highly Pathogenic Avian Influenza A(H5N1) Viruses Isolated from Poultry, Vietnam, 2009–2011
Ha T. Nguyen, Tung Nguyen, Vasiliy P. Mishin, Katrina Sleeman, Amanda Balish, Joyce Jones, Adrian Creanga, Henju Marjuki, Timothy M. Uyeki, Dang H. Nguyen, Diep T. Nguyen, Hoa T. Do, Alexander I. Klimov, Charles T. Davis, and Larisa V. Gubareva
Figure 2
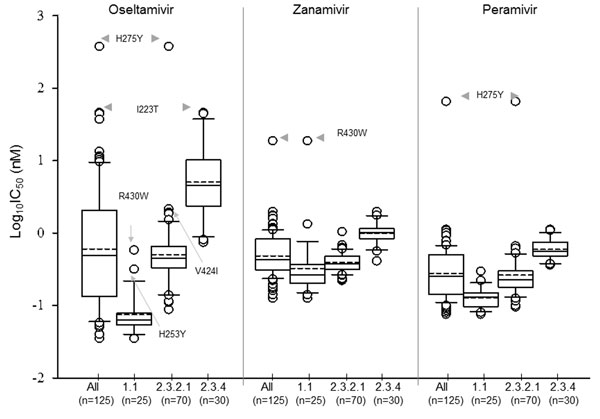
Figure 2. . Distribution of log-transformed 50% inhibitory concentration (IC50) values for oseltamivir, zanamivir, and peramivir: Box-and-whisker plot analysis of all tested highly pathogenic avian influenza A(H5N1) viruses (n = 125) and individual clade for each virus. The boxes represent the 25th (quartile 1) to 75th (quartile 3) percentiles; horizontal and dash lines within the box represent median and mean values, respectively; n, number of viruses tested.
Page created: November 19, 2013
Page updated: November 19, 2013
Page reviewed: November 19, 2013
The conclusions, findings, and opinions expressed by authors contributing to this journal do not necessarily reflect the official position of the U.S. Department of Health and Human Services, the Public Health Service, the Centers for Disease Control and Prevention, or the authors' affiliated institutions. Use of trade names is for identification only and does not imply endorsement by any of the groups named above.