Volume 19, Number 3—March 2013
Dispatch
Swine Influenza in Sri Lanka
Harsha K. K. Perera, Geethani Wickramasinghe, Chung L. Cheung, Hiroshi Nishiura, David K. Smith, Leo L. M. Poon, Aluthgama K. C. Perera, Siu K. Ma, Narapiti P. Sunil-Chandra, Yi Guan, and Joseph S. M. Peiris
Figure 1
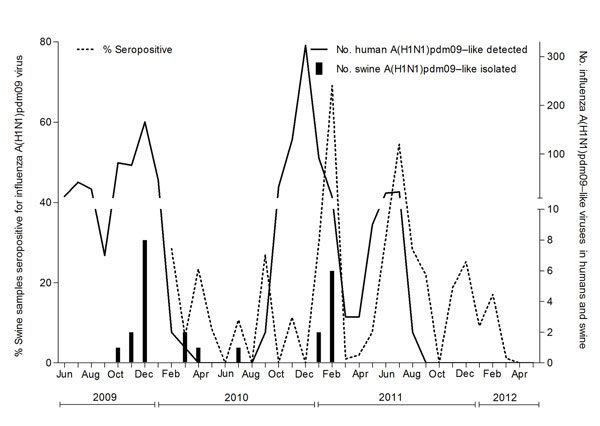
Figure 1. . . Distribution of percentage of swine serum samples seropositive for influenza A(H1N1)pdm09 viruses, by month, and number of A(H1N1)pdm09 viruses detected in humans and swine. The left y-axis represents the percentage of swine serum samples positive for A(H1N1)pdm09 virus. The right y-axis represents the number of swine A(H1N1)pdm09 isolated in the study and reverse transcription PCR–positive human A(H1N1)pdm09 detected in Sri Lanka.
Page created: February 12, 2013
Page updated: February 12, 2013
Page reviewed: February 12, 2013
The conclusions, findings, and opinions expressed by authors contributing to this journal do not necessarily reflect the official position of the U.S. Department of Health and Human Services, the Public Health Service, the Centers for Disease Control and Prevention, or the authors' affiliated institutions. Use of trade names is for identification only and does not imply endorsement by any of the groups named above.