Genetic Variation among African Swine Fever Genotype II Viruses, Eastern and Central Europe
Carmina Gallardo

, Jovita Fernández-Pinero, Virginia Pelayo, Ismail Gazaev, Iwona Markowska-Daniel, Gediminas Pridotkas, Raquel Nieto, Paloma Fernández-Pacheco, Svetlana Bokhan, Oleg Nevolko, Zhanna Drozhzhe, Covadonga Pérez, Alejandro Soler, Denis Kolvasov, and Marisa Arias
Author affiliations: Centro de Investigación en Sanidad Animal (CISA-INIA), Madrid, Spain (C. Gallardo, J. Fernández-Pinero, V. Pelayo, R. Nieto, P. Fernández-Pacheco, C. Pérez, A. Soler, M. Arias); National Institute of Veterinary Virology and Microbiology, Pokrov, Russia (I. Gazaev, D. Kolvasov); National Veterinary Research Institute, Pulawy, Poland (I. Markowska-Daniel); National Food and Veterinary Risk Assessment Institute, Vilnius, Lithuania (G. Pridotkas); Belarusian State Veterinary Centre, Minsk, Belarus (S. Bokhan); State Research Institute of Laboratory Diagnostic and Veterinary Sanitary Expertise, Kiev, Ukraine (O. Nevolko, Z. Drozhzhe)
Main Article
Figure 2

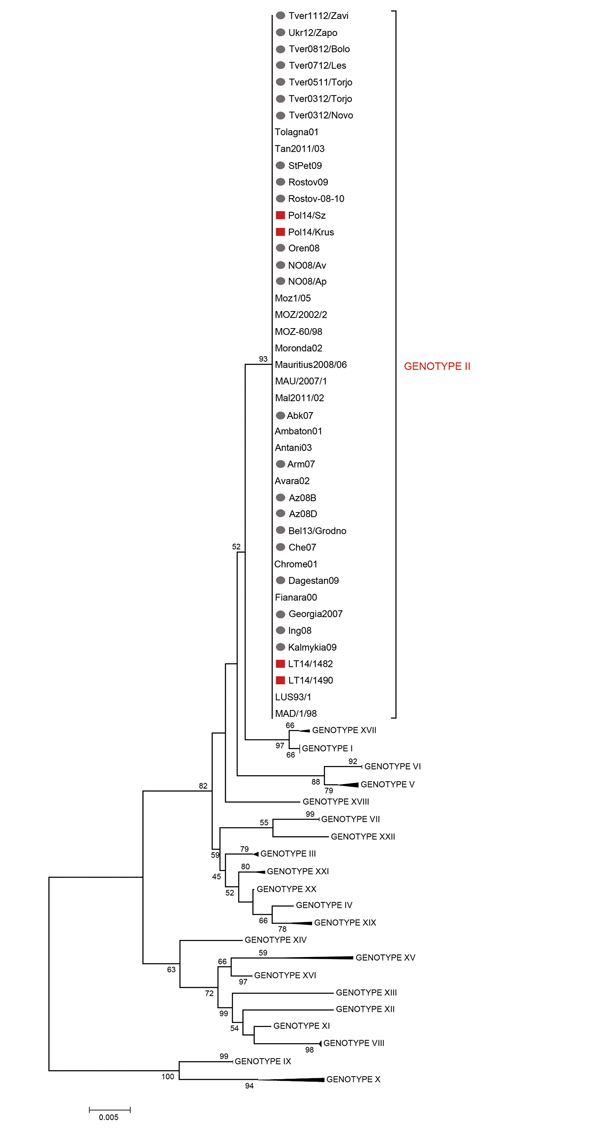
Figure 2. Minimum evolution (ME) phylogenetic tree of African swine fever virus (ASFV) isolates from Lithuania and Poland based on the C-terminal end of the p72 coding gene relative to the 22 p72 genotypes (labeled I-XXII), including 88 nt sequences. The tree was inferred by using the ME method (http://www.megasoftware.net/mega4/WebHelp/part_iv___evolutionary_analysis/constructing_phylogenetic_trees/minimum_evolution_method/rh_minimum_evolution.htm) following initial application of a neighbor-joining algorithm. The phylogenetic tree was rooted by the midpoint method. The percentage of replicate trees >50% in which the associated taxa clustered together by bootstrap analysis (1,000 replicates) is shown adjacent to the nodes. The robustness of the ME tree was tested by using the close-neighbor-interchange algorithm at a search level of 1. Squares indicate ASFV isolates from Lithuania and Poland that were genotyped in this study; circles indicate ASFV isolates during 2007–2013 from the Caucasus region. Scale bar indicates nucleotide mutations per site.
Main Article
Page created: August 14, 2014
Page updated: August 14, 2014
Page reviewed: August 14, 2014
The conclusions, findings, and opinions expressed by authors contributing to this journal do not necessarily reflect the official position of the U.S. Department of Health and Human Services, the Public Health Service, the Centers for Disease Control and Prevention, or the authors' affiliated institutions. Use of trade names is for identification only and does not imply endorsement by any of the groups named above.
