Volume 22, Number 12—December 2016
CME ACTIVITY - Research
Electrolyte and Metabolic Disturbances in Ebola Patients during a Clinical Trial, Guinea, 2015
Johan van Griensven , Elhadj Ibrahima Bah, Nyankoye Haba, Alexandre Delamou, Bienvenu Salim Camara, Kadio Jean-Jacques Olivier, Hilde De Clerck, Helena Nordenstedt, Malcolm G. Semple, Michel Van Herp, Jozefien Buyze, Maaike De Crop, Steven Van Den Broucke, Lutgarde Lynen, Anja De Weggheleire, and the Ebola-Tx Consortium
Figure 2
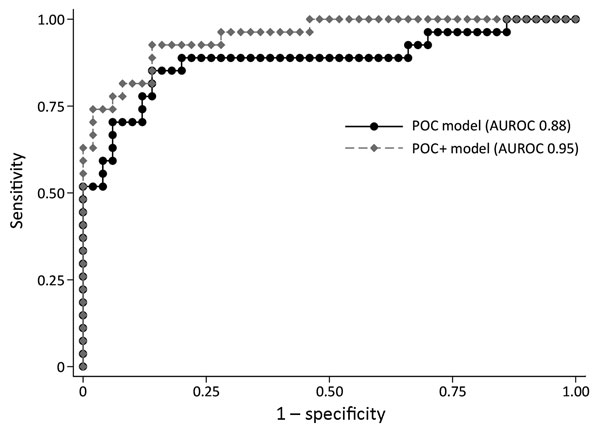
Figure 2. Receiving operating curve summarizing the performance of 3-variable point-of-care (POC) and 5-variable POC+ prognostic prediction models for Ebola patients recruited for the Ebola-Tx trial, Conakry, Guinea, 2015. POC model includes blood creatinine, hemoglobin, and calcium levels. POC+ model includes the same 3 POC measurements plus the cycle threshold value of the diagnostic Ebola PCR result and the age of the patient. AUROC, area under the receiver operating curve; POC, point-of-care.
Page created: November 17, 2016
Page updated: November 17, 2016
Page reviewed: November 17, 2016
The conclusions, findings, and opinions expressed by authors contributing to this journal do not necessarily reflect the official position of the U.S. Department of Health and Human Services, the Public Health Service, the Centers for Disease Control and Prevention, or the authors' affiliated institutions. Use of trade names is for identification only and does not imply endorsement by any of the groups named above.