Volume 22, Number 2—February 2016
Research
Epidemiology of Serotype 1 Invasive Pneumococcal Disease, South Africa, 2003–2013
Claire von Mollendorf , Stefano Tempia, Cheryl Cohen, Susan Meiring, Linda de Gouveia, Vanessa Quan, Sarona Lengana, Alan Karstaedt, Halima Dawood, Sharona Seetharam, Ruth Lekalakala, Shabir A. Madhi, Keith P. Klugman, Anne von Gottberg, and for the Group for Enteric, Respiratory, and Meningeal Disease Surveillance in South Africa (GERMS-SA)
Figure 3
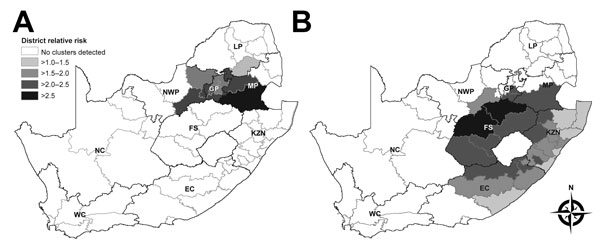
Figure 3. Serotype 1 invasive pneumococcal disease clusters by district, South Africa. A) May 2003–December 2004. B) September 2008–April 2012. Gray borders indicate district boundaries; black borders indicate provincial boundaries. Provinces: EC, Eastern Cape; FS, Free State; GP, Gauteng; KZN, KwaZulu-Natal; LP, Limpopo; MP, Mpumalanga; NC, Northern Cape; NWP, North-West; WC, Western Cape. District relative risk was calculated by dividing the observed number of cases per district by the number of cases expected by district (as determined on the basis of numbers in control groups).
Page created: January 13, 2016
Page updated: January 13, 2016
Page reviewed: January 13, 2016
The conclusions, findings, and opinions expressed by authors contributing to this journal do not necessarily reflect the official position of the U.S. Department of Health and Human Services, the Public Health Service, the Centers for Disease Control and Prevention, or the authors' affiliated institutions. Use of trade names is for identification only and does not imply endorsement by any of the groups named above.