Skip directly to site content Skip directly to page options Skip directly to A-Z link Skip directly to A-Z link Skip directly to A-Z link
Volume 23, Number 12—December 2017
Dispatch

Avian Influenza A(H7N2) Virus in Human Exposed to Sick Cats, New York, USA, 2016

Atanaska Marinova-Petkova, Jen Laplante, Yunho Jang, Brian Lynch, Natosha Zanders, Marisela Rodriguez, Joyce Jones, Sharmi Thor, Erin Hodges, Juan A. De La Cruz, Jessica A. Belser, Hua Yang, Paul Carney, Bo Shu, LaShondra Berman, Thomas Stark, John Barnes, Fiona Havers, Patrick Yang, Susan C. Trock, Alicia Fry, Larisa Gubareva, Joseph S. Bresee, James Stevens, Demetre Daskalakis, Dakai Liu, Christopher Lee, Mia Kim Torchetti, Sandra Newbury, Francine Cigel, Kathy L. Toohey-Kurth, Kirsten St. George, David Wentworth, Stephen Lindstrom, and C. Todd DavisComments to Author 
Author affiliations: Centers for Disease Control and Prevention, Atlanta, Georgia, USA (A. Marinova-Petkova, Y. Jang, B. Lynch, N. Zanders, M. Rodriguez, J. Jones, S. Thor, E. Hodges, J.A. De La Cruz, J. Belser, H. Yang, P. Carney, B. Shu, L. Berman, T. Stark, J. Barnes, F. Havers, P. Yang, S.C. Trock, A. Fry, L. Gubareva, J.S. Bresee, J. Stevens, D.E. Wentworth, S. Lindstrom, C.T. Davis); New York State Department of Health, Albany, New York, USA (J. Laplante, K. St. George); New York City Department of Health and Mental Hygiene, Long Island City, New York, USA (D. Daskalakis, D. Liu, C.T. Lee); US Department of Agriculture, Ames, Iowa, USA (M.K. Torchetti); University of Wisconsin, Madison, Wisconsin, USA (S. Newbury, F. Cigel, K. Toohey-Kurth)

Main Article

Figure 1

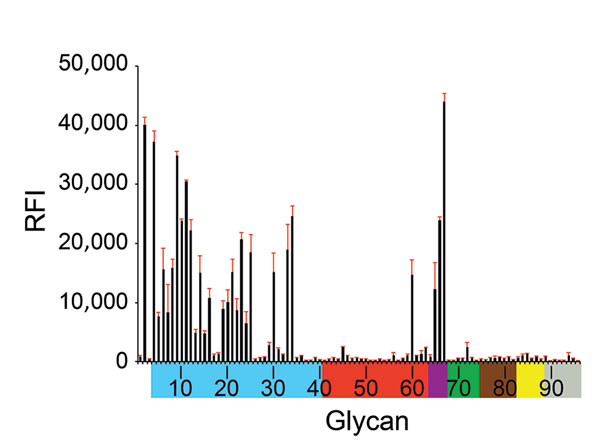
Receptor binding specificity of A/New York/108/2016 (H7N2) influenza virus isolated from a human who experienced influenza-like illness after exposure to sick domestic cats at an animal shelter in New York, NY, USA, 2016. Figure indicates glycan microarray analysis. Colored bars represent glycans that contain α-2,3 sialic acid (SA) (blue), α-2,6 SA (red), α-2,3/α-2,6 mixed SA (purple), N-glycolyl SA (green), α-2,8 SA (brown), β-2,6 and 9-O-acetyl SA (yellow), and non-SA (gray). Error bars reflec

Figure 1. Receptor binding specificity of A/New York/108/2016 (H7N2) influenza virus isolated from a human who experienced influenza-like illness after exposure to sick domestic cats at an animal shelter in New York, NY, USA, 2016. Figure indicates glycan microarray analysis. Colored bars represent glycans that contain α-2,3 sialic acid (SA) (blue), α-2,6 SA (red), α-2,3/α-2,6 mixed SA (purple), N-glycolyl SA (green), α-2,8 SA (brown), β-2,6 and 9-O-acetyl SA (yellow), and non-SA (gray). Error bars reflect SE in the signal for 6 independent replicates on the array. RFI, relative fluorescence intensity.

Main Article

Page created: November 16, 2017
Page updated: November 16, 2017
Page reviewed: November 16, 2017
The conclusions, findings, and opinions expressed by authors contributing to this journal do not necessarily reflect the official position of the U.S. Department of Health and Human Services, the Public Health Service, the Centers for Disease Control and Prevention, or the authors' affiliated institutions. Use of trade names is for identification only and does not imply endorsement by any of the groups named above.
file_external