Volume 23, Number 12—December 2017
Dispatch
Deaths among Wild Birds during Highly Pathogenic Avian Influenza A(H5N8) Virus Outbreak, the Netherlands
Figure 2
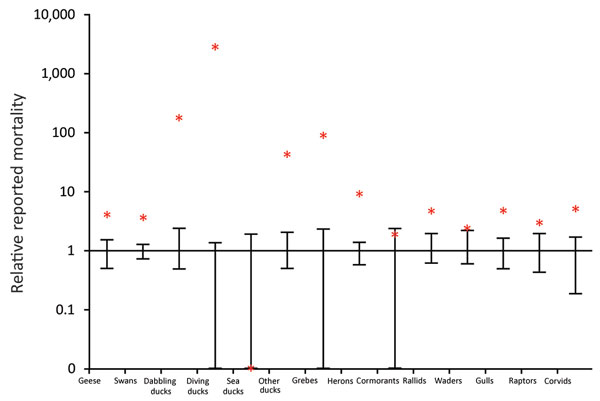
Figure 2. Relative number of deaths among wild birds during an outbreak of highly pathogenic avian influenza A(H5N8) virus, the Netherlands, November 2016–January 2017. Number of reported deaths during November 2016–January 2017 (red asterisks) is shown relative to the normalized number of deaths reported over the same timeframe in the previous 5 years (average is 1, error bars indicate maximum and minimum from 2011–2012 to 2015–2016). The y-axis is on a log-scale (e.g., reported deaths among diving ducks during 2016–2017 was >2,000 times greater than the average reported in the previous 5 years). Within species groups, numbers of deaths are averaged over species. Data from Sovon (Dutch Center for Field Ornithology, Nijmegen, the Netherlands). A graph of the same analysis based on data from the Nature Information Foundation (http://www.waarneming.nl) was also plotted (online Technical Appendix 2, https://wwwnc.cdc.gov/EID/article/23/12/17-1086-Techapp2.pdf).
1Current affiliation: Max Planck Institute for Ornithology, Radolfzell am Bodensee, Germany.
2These senior authors contributed equally to this article.