Volume 24, Number 2—February 2018
Research
Yersinia pestis Survival and Replication in Potential Ameba Reservoir
Figure 2
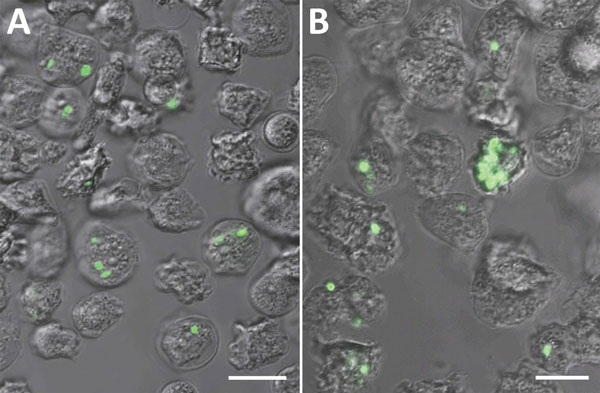
Figure 2. Representative fluorescent confocal images of (A) Acanthamoeba castellanii (B) and Dictyostelium discoideum after experimental co-culture with Yersinia pestis (CO92 pgm+, pCD1, pGFPuv, amp+) and removal of extracellular bacteria. After co-culture of ameba trophozoites and Y. pestis, we determined the prevalence and intensity of bacterial uptake by manual counting of amebae by using z-stack fluorescent confocal microscopy and averaging across 15 fields per replicate of each ameba species. Confocal count data represent the minimum prevalence/intensity values. Bacteria adherent to the outside of ameba or those with uncertain intracellular status were discarded. The minimum count threshold to reduce random count bias to accepted levels was determined to be 500 per ameba species. Scale bars indicate 30 μm.