Volume 25, Number 1—January 2019
Research
Zoonotic Source Attribution of Salmonella enterica Serotype Typhimurium Using Genomic Surveillance Data, United States
Figure 1
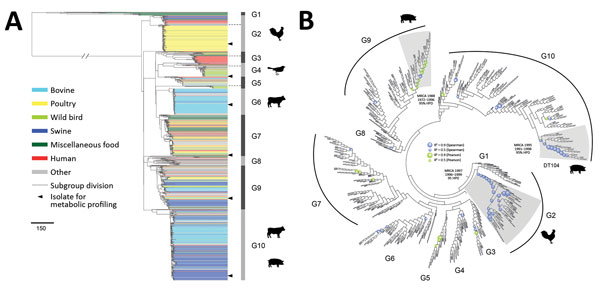
Figure 1. Phylogenetic structure of 1,267 Salmonella enterica serotype Typhimurium isolates. A) Maximum-likelihood phylogeny from 46 US states and 39 other countries. The tree was rooted at midpoint. Ten major population groups (G1–G10) were delineated. Each dashed line shows the division of subgroups in G2, G3, G4, and G5 (e.g., G2a and G2b). Each isolate is color coded by source. Arrowheads indicate isolates selected for metabolic profiling using Phenotype Microarrays (Biolog, https://biolog.com). Scale bar indicates number of single-nucleotide polymorphisms. B) Circular cladogram of the same maximum-likelihood phylogeny of the 1,267 isolates. Colored circles indicate internal nodes that had a squared coefficient (R2) of the Spearman or Pearson correlation between isolation years and branch lengths >0.4. The sizes of the circle are proportional to the values of R2 (0.0–0.9). Clades identified to exhibit temporal signals of single-nucleotide polymorphisms accumulation are shaded in gray. The inferred MRCA age of each clade is shown. HPD, highest posterior density; MRCA, most recent common ancestor.