Zoonotic Source Attribution of Salmonella enterica Serotype Typhimurium Using Genomic Surveillance Data, United States
Shaokang Zhang, Shaoting Li, Weidong Gu, Henk den Bakker, Dave Boxrud, Angie Taylor, Chandler Roe, Elizabeth Driebe, David M. Engelthaler, Marc Allard, Eric Brown, Patrick McDermott, Shaohua Zhao, Beau B. Bruce, Eija Trees, Patricia I. Fields, and Xiangyu Deng

Author affiliations: University of Georgia Center for Food Safety, Griffin, Georgia, USA (S. Zhang, S. Li, H. den Bakker, X. Deng); Centers for Disease Control and Prevention, Atlanta, Georgia, USA (W. Gu, B.B. Bruce, E. Trees, P.I. Fields); Minnesota Department of Health, St. Paul, Minnesota, USA (D. Boxrud, A. Taylor); Translational Genomics Research Institute, Flagstaff, Arizona, USA (C. Roe, E. Driebe, D.M. Engelthaler); US Food and Drug Administration, College Park, Maryland, USA (M. Allard, E.W. Brown); US Food and Drug Administration, Laurel, Maryland, USA (P. McDermott, S. Zhao)
Main Article
Figure 4
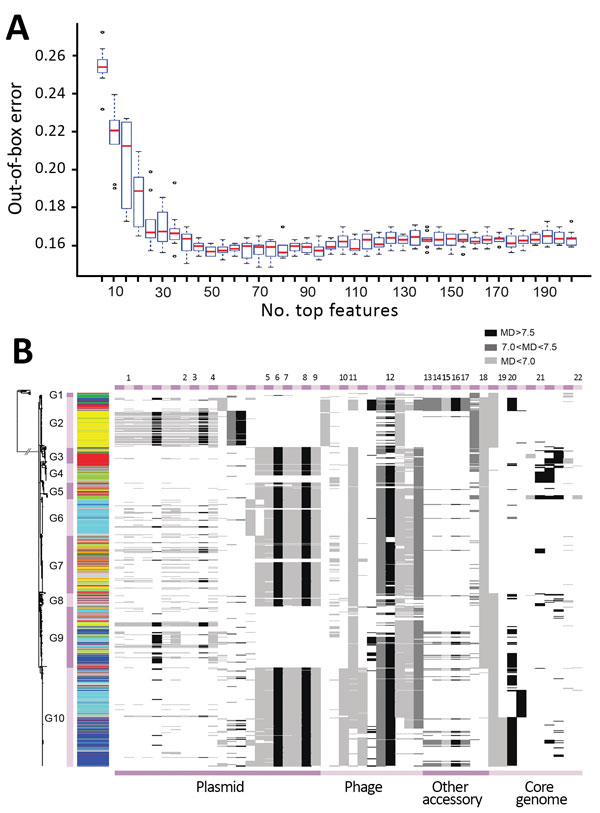
Figure 4. Key genetic features for zoonotic source prediction of Salmonella enterica serotype Typhimurium using Random Forest classifier. A) Change of out-of-bag prediction error rate as incremental inclusion of top ranking genetic features for source prediction. Red lines indicate median values; blue boxes indicate interquartile ranges. Upper and lower whiskers indicate maximum and minimum values. Circles indicate outliers. B) Distribution of top 50 source predicting features among Salmonella Typhimurium isolates on the basis of their location. Cyan, bovine; yellow, poultry; light green, wild bird; blue, swine; dark green, miscellaneous food; red, human; gray, other sources. The presence of a feature in an isolate is shown as a horizontal line in the corresponding location, with its grayscale representing the level of the MD of prediction accuracy through randomly permuting values of the feature. The higher the MD, the more important the feature is for source prediction. MD, mean decrease.
Main Article
Page created: December 18, 2018
Page updated: December 18, 2018
Page reviewed: December 18, 2018
The conclusions, findings, and opinions expressed by authors contributing to this journal do not necessarily reflect the official position of the U.S. Department of Health and Human Services, the Public Health Service, the Centers for Disease Control and Prevention, or the authors' affiliated institutions. Use of trade names is for identification only and does not imply endorsement by any of the groups named above.