Volume 25, Number 1—January 2019
Research
Zoonotic Source Attribution of Salmonella enterica Serotype Typhimurium Using Genomic Surveillance Data, United States
Figure 3
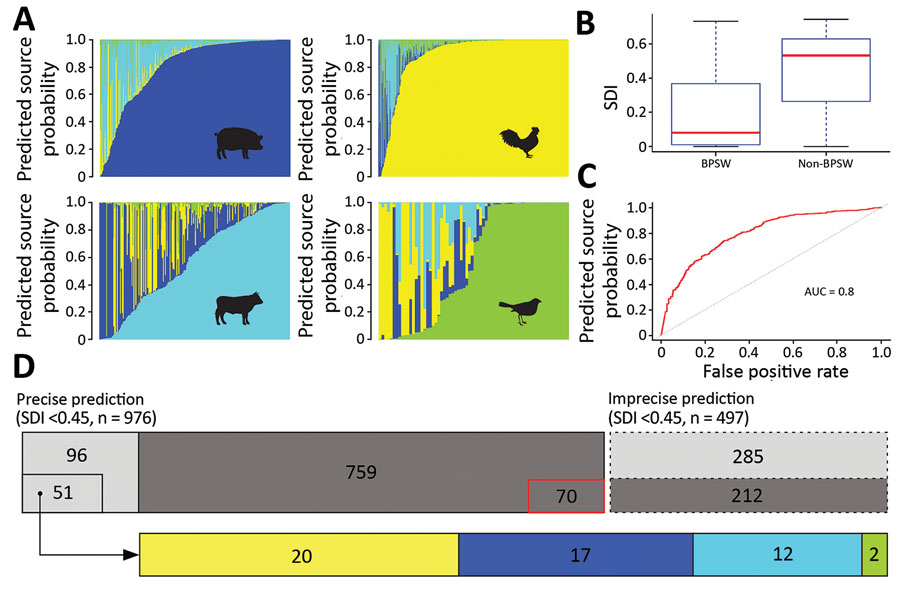
Figure 3. Source prediction by Random Forest classifier. A) Predicted source probabilities for zoonotic Salmonella enterica serotype Typhimurium isolates. Each vertical line in a panel is color coded by predicted source probabilities to proportion: cyan, bovine; yellow, poultry; blue, swine; light green, wild bird. B) Comparison of SDIs of predicted probabilities between BPSW and non-BPSW isolates. For each isolate, SDI was calculated among predicted probabilities of the 4 sources. Red horizontal lines indicate median SDI values; blue box tops and bottoms indicate interquartile ranges; whiskers indicate maximum and minimum SDI values. C) Receiver operating characteristics (ROC) curve of differentiating BPSW and non-BPSW isolates using SDI of predicted source probabilities. The AUC was 0.8, suggesting good binary classification. Red line indicates ROC curve; dotted line indicates diagonal line across the ROC space. D) Summary of source prediction results of 1,473 Salmonella Typhimurium isolates. Rectangles with solid and dashed lines represent precise (SDI <0.45) and imprecise (SDI >0.45) predictions, respectively. Dark gray rectangles, BPSW isolates; light gray rectangles, non-BPSW isolates. The number in each enclosed area is the number of isolates in the category. The sizes of enclosed and gray areas are in proportion to the numbers of isolates they represent. The 70 precisely but incorrectly predicted BPSW isolates are shown with outline. The 51 precisely predicted human isolates were attributed to zoonotic sources: cyan, bovine; yellow, poultry; blue, swine; light green, wild bird. The sizes of source colored rectangles are proportional to the numbers of isolates in the predicted source classes. AUC, area under the ROC curve; BPSW, bovine, poultry, swine, or wild bird; SDI, Simpson diversity index.